|
Download Data (XLS File) |
|
||||||||
|
||||||||
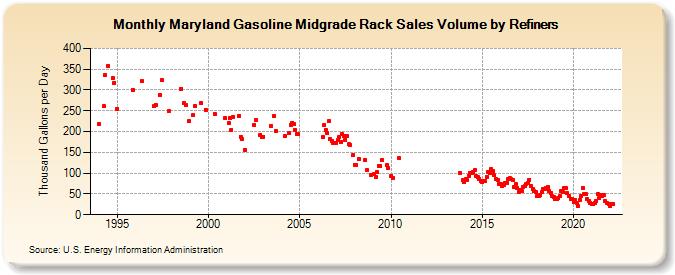
| Maryland Gasoline Midgrade Rack Sales Volume by Refiners (Thousand Gallons per Day) | ||||||||
| Year | Jan | Feb | Mar | Apr | May | Jun | Jul | Aug | Sep | Oct | Nov | Dec |
|---|---|---|---|---|---|---|---|---|---|---|---|---|
| 1994 | 218.0 | W | W | 260.7 | 337.2 | W | 357.8 | W | W | 327.9 | 317.6 | W |
| 1995 | 254.4 | W | W | W | W | W | W | W | W | W | 300.5 | W |
| 1996 | W | W | W | W | 322.1 | W | W | W | W | W | W | W |
| 1997 | 260.6 | 264.1 | W | W | 288.9 | 324.0 | W | W | W | W | 248.6 | W |
| 1998 | W | W | W | W | W | W | 303.1 | W | 267.8 | 263.1 | W | 224.5 |
| 1999 | W | W | 239.8 | 261.7 | W | W | W | 268.2 | W | W | 252.9 | W |
| 2000 | W | W | W | W | 243.0 | W | W | W | W | W | W | 232.4 |
| 2001 | W | 221.0 | 232.5 | 204.0 | 235.4 | W | W | W | 237.7 | 188.1 | 181.6 | W |
| 2002 | 156.5 | W | W | W | W | W | 216.8 | 228.1 | W | W | 192.9 | 188.0 |
| 2003 | 188.1 | W | W | W | W | 213.9 | W | 237.5 | 202.5 | W | W | W |
| 2004 | W | W | 188.3 | W | W | 196.8 | 216.2 | 221.4 | 218.4 | 204.5 | 194.4 | 193.1 |
| 2005 | W | W | W | W | W | W | W | W | W | W | W | W |
| 2006 | W | W | W | 187.1 | 215.4 | 204.9 | 197.0 | 225.1 | 180.9 | 178.1 | 172.3 | 172.9 |
| 2007 | 173.3 | 178.7 | 187.3 | 174.5 | 193.0 | 188.3 | 180.3 | 188.3 | 170.5 | 168.8 | W | 143.6 |
| 2008 | 120.7 | 120.4 | W | 134.1 | W | W | W | 131.9 | 107.1 | W | W | 95.8 |
| 2009 | W | 97.6 | 91.0 | 103.3 | 117.9 | 116.8 | 131.6 | W | W | 119.2 | 113.3 | W |
| 2010 | 94.0 | 88.9 | W | W | W | 136.3 | W | W | W | W | W | W |
| 2011 | W | W | W | W | W | W | W | W | W | W | W | W |
| 2012 | W | W | W | W | W | W | W | W | W | W | W | W |
| 2013 | W | W | W | W | W | W | W | W | W | 99.8 | W | 82.5 |
| 2014 | 78.0 | 85.5 | 82.7 | 94.0 | 101.0 | 100.4 | 102.3 | 106.9 | 92.0 | 90.3 | 86.7 | 80.7 |
| 2015 | 78.1 | 82.0 | 81.5 | 91.6 | 102.6 | 99.7 | 108.9 | 104.5 | 94.7 | 85.9 | 84.2 | 74.2 |
| 2016 | 74.5 | 68.0 | 71.2 | 77.0 | 76.5 | 86.0 | 87.1 | 85.0 | 83.5 | 67.3 | 72.7 | 64.1 |
| 2017 | 55.8 | 59.3 | 57.8 | 67.8 | 68.9 | 74.9 | 77.2 | 84.2 | 68.7 | 61.2 | 56.7 | 54.6 |
| 2018 | 45.2 | 45.6 | 46.7 | 54.5 | 61.1 | 61.1 | 64.7 | 66.4 | 56.0 | 52.9 | 44.9 | 43.1 |
| 2019 | 37.6 | 38.0 | 39.7 | 45.7 | 57.7 | 54.7 | 63.2 | 64.2 | 51.2 | 44.8 | 38.7 | 36.8 |
| 2020 | 30.9 | 34.6 | 28.0 | 20.6 | 34.2 | 45.3 | 64.4 | 50.6 | 49.6 | 37.0 | 33.8 | 28.8 |
| 2021 | 24.9 | 25.2 | 28.8 | 33.3 | 49.7 | 41.1 | 47.8 | 44.4 | 47.5 | 32.5 | 29.0 | 26.7 |
| 2022 | 20.2 | 25.8 | 25.7 | |||||||||
| - = No Data Reported; -- = Not Applicable; NA = Not Available; W = Withheld to avoid disclosure of individual company data. |
| Release Date: 6/1/2022 |
| Next Release Date: TBD |