|
Download Data (XLS File) |
|
||||||||
|
||||||||
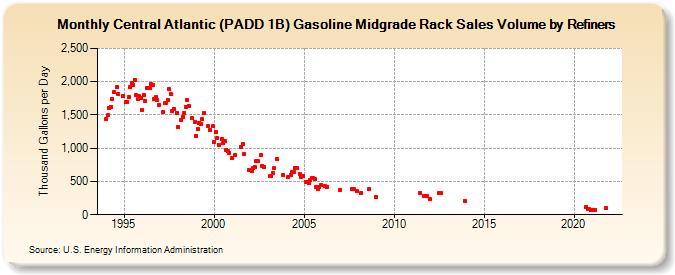
| Central Atlantic (PADD 1B) Gasoline Midgrade Rack Sales Volume by Refiners (Thousand Gallons per Day) | ||||||||
| Year | Jan | Feb | Mar | Apr | May | Jun | Jul | Aug | Sep | Oct | Nov | Dec |
|---|---|---|---|---|---|---|---|---|---|---|---|---|
| 1994 | 1,443.4 | 1,491.3 | 1,611.4 | 1,626.1 | 1,746.2 | 1,840.0 | W | 1,921.7 | 1,814.8 | W | W | 1,784.2 |
| 1995 | W | 1,687.5 | 1,696.0 | 1,769.6 | 1,913.3 | 1,982.7 | 1,954.5 | 2,029.4 | 1,798.6 | 1,735.6 | 1,778.2 | 1,754.9 |
| 1996 | 1,581.2 | 1,799.8 | 1,709.9 | 1,903.1 | 1,904.8 | 1,912.0 | 1,968.2 | 1,948.5 | 1,744.7 | 1,766.9 | 1,725.2 | 1,653.2 |
| 1997 | W | W | 1,548.7 | 1,675.4 | 1,683.2 | 1,726.2 | 1,889.1 | 1,811.1 | 1,557.9 | 1,593.0 | W | 1,531.0 |
| 1998 | 1,316.7 | W | 1,424.8 | 1,470.4 | 1,527.0 | 1,620.4 | 1,720.9 | 1,637.6 | W | 1,452.6 | W | 1,393.7 |
| 1999 | 1,184.7 | 1,295.6 | 1,378.8 | 1,359.3 | 1,434.1 | 1,530.1 | W | W | 1,327.3 | 1,273.6 | W | 1,326.4 |
| 2000 | 1,099.5 | 1,237.1 | 1,149.4 | 1,053.5 | W | 1,145.5 | 1,072.4 | 1,100.7 | 976.2 | 952.5 | 926.7 | W |
| 2001 | 852.9 | W | 904.5 | W | W | W | 1,019.1 | 1,067.5 | 906.6 | W | W | 671.4 |
| 2002 | W | 661.4 | 699.5 | 723.4 | 814.6 | 814.2 | W | 895.7 | 739.4 | 711.7 | W | W |
| 2003 | W | 585.5 | 585.6 | 626.9 | 699.0 | W | 836.4 | W | W | W | 603.2 | W |
| 2004 | W | 560.8 | W | 601.3 | 645.5 | 644.9 | 709.5 | 699.3 | W | 609.5 | 569.5 | 586.1 |
| 2005 | W | 498.0 | 493.6 | 478.3 | 515.3 | 556.4 | 549.9 | 536.5 | 422.6 | 391.5 | 412.3 | 442.5 |
| 2006 | W | W | 429.9 | 412.7 | W | W | W | W | W | W | W | W |
| 2007 | 371.0 | W | W | W | W | W | W | W | 387.3 | 381.1 | W | 356.3 |
| 2008 | W | W | 328.1 | W | W | W | W | 379.0 | W | W | W | W |
| 2009 | 269.4 | W | W | W | W | W | W | W | W | W | W | W |
| 2010 | W | W | W | W | W | W | W | W | W | W | W | W |
| 2011 | W | W | W | W | W | 332.3 | W | W | 288.0 | 281.2 | 279.3 | W |
| 2012 | 228.7 | W | W | W | W | W | 330.7 | 322.2 | W | W | W | W |
| 2013 | W | W | W | W | W | W | W | W | W | W | W | 206.3 |
| 2014 | W | W | W | W | W | W | W | W | W | W | W | W |
| 2015 | W | W | W | W | W | W | W | W | W | W | W | W |
| 2016 | W | W | W | W | W | W | W | W | W | W | W | W |
| 2017 | W | W | W | W | W | W | W | W | W | W | W | W |
| 2018 | W | W | W | W | W | W | W | W | W | W | W | W |
| 2019 | W | W | W | W | W | W | W | W | W | W | W | W |
| 2020 | W | W | W | W | W | W | W | W | 117.6 | 89.4 | 81.1 | 72.1 |
| 2021 | 64.7 | W | 74.5 | W | W | W | W | W | W | 106.0 | W | W |
| 2022 | W | W | W | |||||||||
| - = No Data Reported; -- = Not Applicable; NA = Not Available; W = Withheld to avoid disclosure of individual company data. |
| Release Date: 6/1/2022 |
| Next Release Date: TBD |