|
Download Data (XLS File) |
|
||||||||
|
||||||||
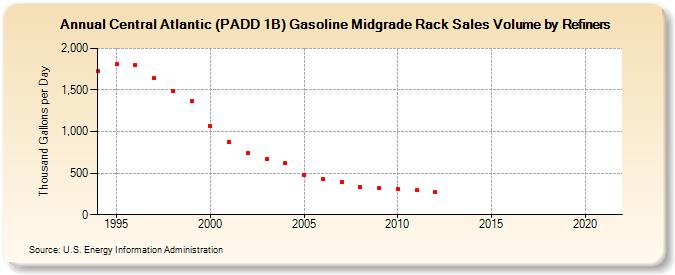
| Central Atlantic (PADD 1B) Gasoline Midgrade Rack Sales Volume by Refiners (Thousand Gallons per Day) | ||||||||
| Decade | Year-0 | Year-1 | Year-2 | Year-3 | Year-4 | Year-5 | Year-6 | Year-7 | Year-8 | Year-9 |
|---|---|---|---|---|---|---|---|---|---|---|
| 1990's | 1,727.0 | 1,807.4 | 1,801.2 | 1,640.2 | 1,488.4 | 1,369.9 | ||||
| 2000's | 1,067.1 | 879.7 | 741.2 | 670.6 | 617.4 | 480.7 | 432.5 | 396.1 | 332.7 | 321.7 |
| 2010's | 304.7 | 291.4 | 271.3 | W | W | W | W | W | W | W |
| 2020's | W |
| - = No Data Reported; -- = Not Applicable; NA = Not Available; W = Withheld to avoid disclosure of individual company data. |
| Release Date: 6/1/2022 |
| Next Release Date: TBD |