|
Download Data (XLS File) |
|
||||||||
|
||||||||
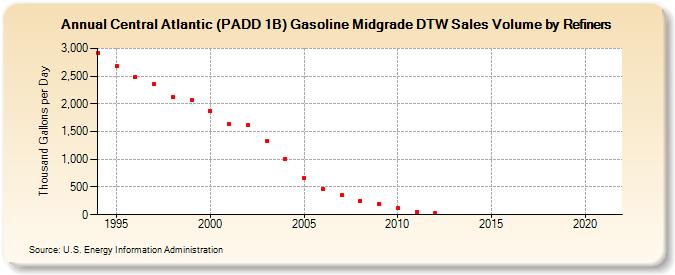
| Central Atlantic (PADD 1B) Gasoline Midgrade DTW Sales Volume by Refiners (Thousand Gallons per Day) | ||||||||
| Decade | Year-0 | Year-1 | Year-2 | Year-3 | Year-4 | Year-5 | Year-6 | Year-7 | Year-8 | Year-9 |
|---|---|---|---|---|---|---|---|---|---|---|
| 1990's | 2,919.8 | 2,679.5 | 2,485.6 | 2,355.6 | 2,116.2 | 2,068.8 | ||||
| 2000's | 1,866.5 | 1,632.2 | 1,620.6 | 1,326.9 | 1,007.3 | 670.8 | 454.9 | 354.9 | 253.9 | 200.0 |
| 2010's | 120.9 | 51.3 | 28.2 | W | W | W | W | W | W | W |
| 2020's | W |
| - = No Data Reported; -- = Not Applicable; NA = Not Available; W = Withheld to avoid disclosure of individual company data. |
| Release Date: 6/1/2022 |
| Next Release Date: TBD |