|
Download Data (XLS File) |
|
||||||||
|
||||||||
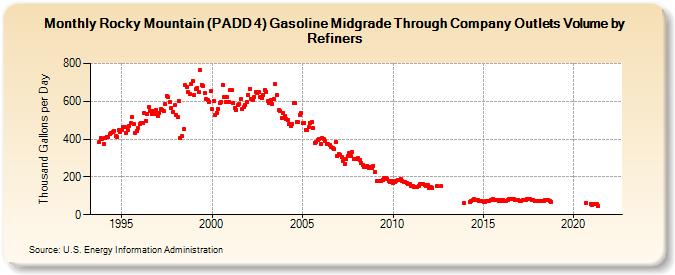
| Rocky Mountain (PADD 4) Gasoline Midgrade Through Company Outlets Volume by Refiners (Thousand Gallons per Day) | ||||||||
| Year | Jan | Feb | Mar | Apr | May | Jun | Jul | Aug | Sep | Oct | Nov | Dec |
|---|---|---|---|---|---|---|---|---|---|---|---|---|
| 1993 | 382.7 | 404.0 | 403.1 | |||||||||
| 1994 | 376.5 | 405.0 | 413.3 | 408.6 | 424.6 | 433.3 | 438.0 | 445.0 | 415.1 | 413.5 | 446.7 | 438.9 |
| 1995 | 446.5 | 463.0 | 461.7 | 434.1 | 446.1 | 469.7 | 484.6 | 515.0 | 478.5 | 434.5 | 445.4 | 459.0 |
| 1996 | 477.7 | 487.3 | 484.0 | 538.9 | 498.0 | 532.7 | 569.6 | 548.9 | 531.1 | 546.1 | 532.2 | 554.4 |
| 1997 | 519.7 | 539.8 | 558.6 | 553.7 | 546.5 | 584.1 | 628.1 | 620.6 | 597.5 | 566.0 | 543.2 | 578.4 |
| 1998 | 528.5 | 517.1 | 601.3 | 406.2 | 414.9 | 451.2 | 684.7 | 674.3 | 651.2 | 639.2 | 691.8 | 709.6 |
| 1999 | 633.0 | 663.6 | 669.2 | 647.6 | 765.6 | 687.8 | 681.6 | 642.6 | 610.3 | 607.5 | 598.2 | 652.3 |
| 2000 | 557.8 | 600.2 | 529.5 | 539.6 | 559.6 | 592.3 | 598.0 | 687.7 | 620.3 | 593.7 | 621.2 | 598.7 |
| 2001 | 661.1 | 660.8 | 591.0 | 564.3 | 554.9 | 579.2 | 587.5 | 611.6 | 557.6 | 567.6 | 578.1 | 594.4 |
| 2002 | 634.6 | 667.3 | 614.5 | 608.0 | 623.4 | 649.2 | 642.0 | 651.6 | 622.3 | 620.0 | 633.1 | 661.7 |
| 2003 | 651.6 | 599.8 | 593.1 | 607.9 | 586.9 | 614.0 | 689.3 | 635.7 | 551.3 | 548.3 | 512.1 | 538.8 |
| 2004 | 523.1 | 506.1 | 498.5 | 478.0 | 469.3 | 480.3 | 589.9 | 589.1 | 490.0 | 489.0 | 527.2 | 539.9 |
| 2005 | 483.4 | 486.7 | 449.4 | 447.9 | 462.0 | 484.9 | 488.4 | 456.9 | 380.7 | 384.5 | 397.8 | 403.0 |
| 2006 | 373.5 | 404.1 | 398.4 | 387.4 | 376.0 | 371.7 | 370.6 | 358.1 | 350.5 | 347.0 | 384.2 | 309.6 |
| 2007 | 320.9 | 318.3 | 303.5 | 282.4 | 269.0 | 293.1 | 311.0 | 325.1 | 308.6 | 330.1 | 295.2 | 296.8 |
| 2008 | 294.9 | 298.4 | 286.9 | 274.2 | 262.9 | 254.5 | 250.6 | 258.0 | 248.9 | 250.1 | 248.4 | 260.0 |
| 2009 | 225.1 | 175.8 | 180.4 | 176.4 | 180.8 | 185.0 | 194.6 | 195.7 | 189.0 | 180.7 | 172.5 | 180.8 |
| 2010 | 166.5 | 170.8 | 180.9 | 184.9 | 184.1 | 191.4 | 180.3 | 175.2 | 173.3 | 167.0 | 162.8 | 161.4 |
| 2011 | 154.5 | 153.7 | 146.9 | 147.3 | 144.6 | 153.3 | 165.1 | 162.9 | 161.3 | 156.5 | 151.3 | 154.9 |
| 2012 | 142.7 | 147.1 | 140.3 | W | W | 152.2 | W | W | 149.8 | W | W | W |
| 2013 | W | W | W | W | W | W | W | W | W | W | W | 59.7 |
| 2014 | W | W | W | 68.2 | 73.5 | 77.7 | 80.6 | 78.7 | 76.1 | 73.0 | 73.8 | 72.5 |
| 2015 | 69.9 | 68.9 | 71.9 | 74.3 | 73.9 | 78.2 | 82.9 | 79.9 | 79.2 | 78.5 | 74.5 | 76.1 |
| 2016 | 74.0 | 76.7 | 74.3 | 74.8 | 77.1 | 83.5 | 85.7 | 84.1 | 82.0 | 78.2 | 77.2 | 79.5 |
| 2017 | 72.7 | 74.4 | 76.8 | W | 79.1 | 84.4 | 83.0 | 81.6 | 77.7 | 76.7 | 73.3 | 74.4 |
| 2018 | W | 74.0 | 74.7 | 72.4 | 73.0 | 76.3 | 76.0 | 77.9 | 74.0 | 68.9 | W | W |
| 2019 | W | W | W | W | W | W | W | W | W | W | W | W |
| 2020 | W | W | W | W | W | W | W | W | 62.1 | W | W | 54.1 |
| 2021 | 53.6 | 59.0 | 55.5 | 54.4 | 47.8 | W | W | W | W | W | W | W |
| 2022 | W | W | W | |||||||||
| - = No Data Reported; -- = Not Applicable; NA = Not Available; W = Withheld to avoid disclosure of individual company data. |
| Release Date: 6/1/2022 |
| Next Release Date: TBD |