|
Download Data (XLS File) |
|
||||||||
|
||||||||
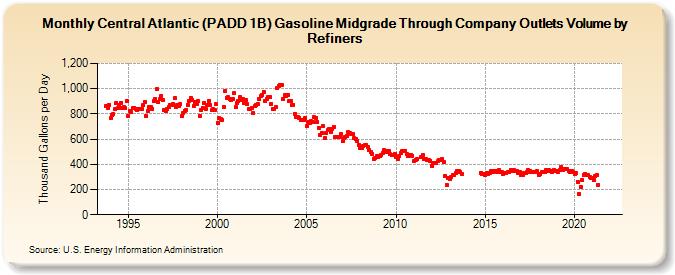
| Central Atlantic (PADD 1B) Gasoline Midgrade Through Company Outlets Volume by Refiners (Thousand Gallons per Day) | ||||||||
| Year | Jan | Feb | Mar | Apr | May | Jun | Jul | Aug | Sep | Oct | Nov | Dec |
|---|---|---|---|---|---|---|---|---|---|---|---|---|
| 1993 | 862.2 | 849.8 | 873.5 | |||||||||
| 1994 | 764.7 | 792.4 | 800.8 | 836.5 | 888.4 | 844.6 | 869.1 | 889.7 | 847.7 | 853.7 | 846.6 | 904.6 |
| 1995 | 782.4 | 820.1 | 816.6 | 846.3 | 848.8 | 842.0 | 832.1 | 837.1 | 836.3 | 836.9 | 867.3 | 895.5 |
| 1996 | 781.4 | 825.8 | 853.1 | 853.6 | 842.7 | 899.6 | 919.8 | 996.5 | 893.7 | 917.9 | 944.2 | 913.1 |
| 1997 | 834.5 | 824.4 | 838.5 | 854.5 | 873.5 | 870.1 | 878.1 | 926.0 | 851.6 | 868.9 | 860.5 | 877.5 |
| 1998 | 783.7 | 809.6 | 825.2 | 832.7 | 871.1 | 904.0 | 928.4 | 912.4 | 863.2 | 890.4 | 880.1 | 900.8 |
| 1999 | 784.5 | 832.6 | 849.6 | 885.4 | 840.7 | 873.6 | 905.0 | 872.1 | 831.0 | 837.6 | 831.0 | 875.9 |
| 2000 | 728.2 | 765.2 | 759.1 | 753.9 | 853.4 | 980.1 | 928.4 | 931.0 | 920.3 | 911.9 | 920.3 | 962.6 |
| 2001 | 850.9 | 882.8 | 899.8 | 930.6 | 912.2 | 914.8 | 889.8 | 911.3 | 875.8 | 840.2 | 838.0 | 848.4 |
| 2002 | 804.6 | 859.9 | 869.8 | 878.8 | 916.7 | 939.9 | 947.0 | 976.1 | 904.9 | 918.0 | 933.4 | 933.4 |
| 2003 | 882.4 | 838.9 | 838.0 | 854.0 | 1,001.8 | 1,018.7 | 1,031.4 | 1,031.5 | 919.8 | 947.3 | 938.7 | 952.5 |
| 2004 | 901.8 | 900.4 | 874.1 | 873.9 | 801.5 | 774.1 | 774.2 | 771.3 | 751.7 | 754.6 | 748.2 | 767.2 |
| 2005 | 702.9 | 735.3 | 727.9 | 741.0 | 732.4 | 772.1 | 765.7 | 738.9 | 691.4 | 634.5 | 651.9 | 702.2 |
| 2006 | 609.9 | 648.5 | 670.5 | 676.6 | 652.7 | 681.9 | 695.4 | 614.9 | 618.4 | 620.4 | 620.5 | 639.2 |
| 2007 | 586.6 | 607.8 | 612.7 | 623.8 | 658.2 | 651.5 | 643.1 | 639.4 | 607.4 | 599.2 | 581.4 | 554.4 |
| 2008 | 526.2 | 532.6 | 545.9 | 552.2 | 554.5 | 538.8 | 513.9 | 499.6 | 482.7 | 445.6 | 448.0 | 466.5 |
| 2009 | 457.6 | 467.4 | 470.3 | 492.7 | 509.6 | 503.2 | 497.6 | 505.2 | 478.2 | 472.7 | 471.7 | 485.1 |
| 2010 | 459.4 | 438.4 | 469.7 | 493.3 | 502.9 | 507.5 | 507.8 | 484.8 | 462.5 | 477.7 | 470.9 | 469.8 |
| 2011 | 425.7 | 437.0 | 441.4 | W | W | 459.1 | 473.7 | 445.8 | 441.7 | 435.6 | 433.8 | 429.7 |
| 2012 | 390.4 | 408.0 | 410.4 | 411.3 | 422.5 | 434.3 | 433.9 | 442.4 | 420.3 | 308.0 | 236.4 | 293.8 |
| 2013 | 285.4 | 302.5 | 312.6 | 314.8 | 330.5 | 343.5 | 345.4 | 336.2 | 323.7 | NA | NA | W |
| 2014 | W | W | W | W | W | W | W | W | W | 333.7 | 327.0 | 324.3 |
| 2015 | 312.0 | 329.4 | 327.0 | 331.5 | 346.9 | 339.2 | 345.1 | 346.7 | 342.6 | 351.7 | 338.7 | 337.3 |
| 2016 | 321.7 | 333.0 | 332.7 | 335.0 | 340.1 | 355.6 | 349.3 | 354.3 | 349.5 | 343.5 | 332.6 | 340.5 |
| 2017 | 313.3 | 315.9 | 329.5 | 332.2 | 336.4 | 355.4 | 347.5 | 342.0 | 337.5 | 340.3 | 338.2 | 344.2 |
| 2018 | 316.8 | 322.4 | 335.6 | 336.3 | 342.2 | 358.4 | 350.7 | 352.2 | 344.0 | 342.1 | 357.0 | 345.6 |
| 2019 | 344.1 | 340.9 | 353.2 | 377.4 | 356.2 | 365.9 | 365.8 | 361.2 | 347.4 | 341.5 | 350.6 | 339.6 |
| 2020 | 321.2 | 328.2 | 262.8 | 166.9 | 219.9 | 275.3 | 316.9 | 322.0 | 315.7 | 316.2 | 301.5 | 294.8 |
| 2021 | 290.5 | 275.0 | 304.5 | 316.6 | 237.2 | W | W | W | W | W | W | W |
| 2022 | W | W | W | |||||||||
| - = No Data Reported; -- = Not Applicable; NA = Not Available; W = Withheld to avoid disclosure of individual company data. |
| Release Date: 6/1/2022 |
| Next Release Date: TBD |