|
Download Data (XLS File) |
|
||||||||
|
||||||||
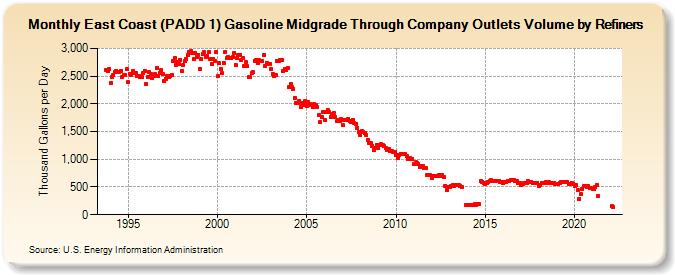
| East Coast (PADD 1) Gasoline Midgrade Through Company Outlets Volume by Refiners (Thousand Gallons per Day) | ||||||||
| Year | Jan | Feb | Mar | Apr | May | Jun | Jul | Aug | Sep | Oct | Nov | Dec |
|---|---|---|---|---|---|---|---|---|---|---|---|---|
| 1993 | 2,616.0 | 2,588.6 | 2,620.4 | |||||||||
| 1994 | 2,369.3 | 2,487.9 | 2,525.6 | 2,578.5 | 2,588.6 | 2,570.1 | 2,574.1 | 2,598.0 | 2,488.2 | 2,521.5 | 2,514.8 | 2,621.2 |
| 1995 | 2,387.7 | 2,529.9 | 2,525.1 | 2,589.0 | 2,556.6 | 2,558.9 | 2,499.1 | 2,493.6 | 2,484.5 | 2,476.2 | 2,552.3 | 2,588.4 |
| 1996 | 2,360.2 | 2,492.2 | 2,568.3 | 2,529.1 | 2,457.5 | 2,508.5 | 2,535.9 | 2,653.3 | 2,497.5 | 2,554.3 | 2,601.5 | 2,537.4 |
| 1997 | 2,408.2 | 2,444.9 | 2,504.2 | 2,491.7 | 2,500.4 | 2,516.2 | 2,770.1 | 2,827.5 | 2,693.9 | 2,749.4 | 2,714.2 | 2,796.3 |
| 1998 | 2,589.8 | 2,696.9 | 2,770.3 | 2,816.5 | 2,881.7 | 2,943.3 | 2,952.3 | 2,920.5 | 2,800.4 | 2,908.9 | 2,850.2 | 2,881.0 |
| 1999 | 2,620.5 | 2,804.0 | 2,894.9 | 2,929.0 | 2,844.8 | 2,868.2 | 2,930.5 | 2,807.6 | 2,718.5 | 2,805.2 | 2,773.7 | 2,931.0 |
| 2000 | 2,500.2 | 2,727.6 | 2,626.9 | 2,548.3 | 2,732.7 | 2,937.3 | 2,821.9 | 2,836.7 | 2,821.1 | 2,826.0 | 2,844.3 | 2,919.5 |
| 2001 | 2,697.9 | 2,826.4 | 2,875.6 | 2,889.5 | 2,792.3 | 2,825.9 | 2,675.9 | 2,754.6 | 2,676.1 | 2,481.5 | 2,482.3 | 2,554.7 |
| 2002 | 2,566.7 | 2,780.5 | 2,783.9 | 2,740.3 | 2,782.0 | 2,780.9 | 2,770.0 | 2,883.3 | 2,684.2 | 2,744.2 | 2,719.6 | 2,725.5 |
| 2003 | 2,620.1 | 2,546.3 | 2,505.4 | 2,520.2 | 2,781.5 | 2,765.9 | 2,787.0 | 2,787.4 | 2,584.3 | 2,624.4 | 2,614.3 | 2,642.0 |
| 2004 | 2,302.8 | 2,353.1 | 2,302.8 | 2,275.8 | 2,109.8 | 2,011.4 | 2,007.5 | 2,054.5 | 1,951.5 | 2,021.7 | 1,981.1 | 2,043.5 |
| 2005 | 1,956.5 | 2,031.8 | 1,991.3 | 1,981.3 | 1,937.2 | 1,994.6 | 1,977.8 | 1,943.8 | 1,799.3 | 1,671.3 | 1,759.6 | 1,849.5 |
| 2006 | 1,709.4 | 1,845.1 | 1,893.2 | 1,854.5 | 1,764.4 | 1,818.9 | 1,831.5 | 1,764.7 | 1,685.0 | 1,708.2 | 1,699.3 | 1,722.8 |
| 2007 | 1,627.1 | 1,707.6 | 1,711.9 | 1,704.4 | 1,734.5 | 1,695.7 | 1,679.8 | 1,715.6 | 1,650.0 | 1,644.6 | 1,566.9 | 1,498.5 |
| 2008 | 1,430.7 | 1,501.3 | 1,491.1 | 1,476.1 | 1,435.5 | 1,350.3 | 1,291.3 | 1,285.9 | 1,248.2 | 1,166.7 | 1,194.8 | 1,257.0 |
| 2009 | 1,208.4 | 1,255.9 | 1,268.6 | 1,260.0 | 1,243.7 | 1,206.6 | 1,168.9 | 1,188.5 | 1,142.9 | 1,143.4 | 1,123.2 | 1,135.9 |
| 2010 | 1,075.3 | 1,030.6 | 1,069.1 | 1,101.7 | 1,102.5 | 1,101.7 | 1,087.3 | 1,053.8 | 1,013.2 | 1,020.7 | 1,005.3 | 1,000.9 |
| 2011 | 913.3 | 949.6 | 937.0 | 914.3 | 864.2 | 873.0 | 884.1 | 849.8 | 843.2 | 715.9 | 711.8 | 711.6 |
| 2012 | 658.3 | 692.0 | 699.4 | 689.8 | 698.1 | 711.7 | 701.9 | 719.5 | 686.6 | 524.1 | 448.9 | 501.8 |
| 2013 | 493.2 | 524.8 | 531.7 | 525.4 | 544.1 | 532.7 | 529.0 | 523.7 | 502.0 | NA | NA | 171.1 |
| 2014 | 166.8 | 170.8 | 181.2 | 179.1 | 184.2 | 186.3 | 181.6 | 186.4 | 186.1 | 599.1 | 586.4 | 579.8 |
| 2015 | 561.9 | 575.7 | 584.3 | 605.1 | 619.5 | 607.3 | 610.0 | 612.0 | 600.3 | 609.3 | 588.9 | 591.7 |
| 2016 | 563.8 | 589.0 | 593.4 | 601.3 | 603.5 | 623.0 | 617.2 | 619.5 | 611.7 | 600.2 | 577.0 | 573.8 |
| 2017 | 528.5 | 549.4 | 571.4 | 576.5 | 580.8 | 599.5 | 586.5 | 586.1 | 567.4 | 579.5 | 572.6 | 578.0 |
| 2018 | 521.9 | 543.9 | 563.8 | 566.7 | 569.7 | 591.2 | 575.5 | 584.7 | 567.4 | 568.3 | 578.7 | 558.3 |
| 2019 | 550.3 | 554.2 | 573.9 | 597.6 | 582.4 | 586.8 | 586.0 | 593.0 | 558.1 | 559.7 | 567.9 | 549.4 |
| 2020 | 524.7 | 536.9 | 440.0 | 290.3 | 371.8 | 455.6 | 511.2 | 514.0 | 506.9 | 512.2 | 489.3 | 487.9 |
| 2021 | 470.4 | 463.0 | 506.2 | 528.9 | 330.5 | W | W | W | W | W | W | W |
| 2022 | NA | 156.5 | 147.7 | |||||||||
| - = No Data Reported; -- = Not Applicable; NA = Not Available; W = Withheld to avoid disclosure of individual company data. |
| Release Date: 6/1/2022 |
| Next Release Date: TBD |