|
Download Data (XLS File) |
|
||||||||
|
||||||||
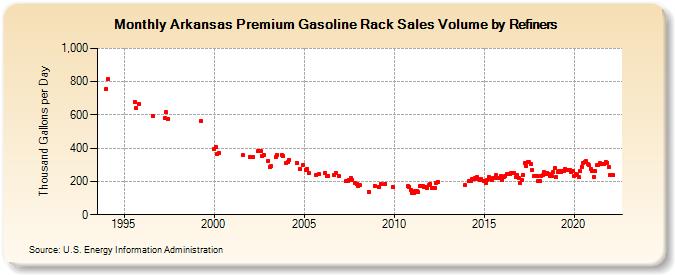
| Arkansas Premium Gasoline Rack Sales Volume by Refiners (Thousand Gallons per Day) | ||||||||
| Year | Jan | Feb | Mar | Apr | May | Jun | Jul | Aug | Sep | Oct | Nov | Dec |
|---|---|---|---|---|---|---|---|---|---|---|---|---|
| 1994 | 757.2 | 813.0 | W | W | W | W | W | W | W | W | W | W |
| 1995 | W | W | W | W | W | W | W | 679.4 | 639.5 | W | 668.0 | W |
| 1996 | W | W | W | W | W | W | W | 591.8 | W | W | W | W |
| 1997 | W | W | W | 579.0 | 614.9 | 575.9 | W | W | W | W | W | W |
| 1998 | W | W | W | W | W | W | W | W | W | W | W | W |
| 1999 | W | W | W | 563.8 | W | W | W | W | W | W | W | W |
| 2000 | 396.8 | 407.7 | 363.8 | 372.0 | W | W | W | W | W | W | W | W |
| 2001 | W | W | W | W | W | W | W | 358.1 | W | W | W | W |
| 2002 | 348.1 | W | 349.2 | W | W | 380.5 | W | 380.7 | 351.9 | 360.5 | W | W |
| 2003 | 324.3 | 285.5 | 292.4 | W | W | 347.4 | 360.5 | W | W | 361.7 | 350.2 | W |
| 2004 | 313.8 | 318.8 | 331.7 | W | W | W | W | 311.3 | W | 275.5 | W | 296.1 |
| 2005 | W | 271.1 | 276.8 | 249.6 | W | W | W | W | 237.4 | W | 242.8 | W |
| 2006 | W | W | 253.4 | 234.0 | 233.3 | W | W | W | 238.6 | 252.1 | W | 232.4 |
| 2007 | W | W | W | W | 201.2 | 200.4 | 210.9 | 222.1 | 209.1 | W | 192.4 | 187.2 |
| 2008 | 175.2 | 176.9 | W | W | W | W | W | 138.3 | W | W | W | 174.7 |
| 2009 | W | W | 168.3 | 182.9 | W | W | 187.1 | W | W | W | W | 165.9 |
| 2010 | W | W | W | W | W | NA | W | W | W | 170.6 | 168.9 | 150.2 |
| 2011 | 129.1 | 131.0 | 140.6 | 140.2 | 137.5 | 171.1 | W | 174.9 | 168.8 | 168.4 | 161.8 | 178.5 |
| 2012 | 183.3 | 160.6 | 159.7 | 163.2 | 192.8 | 199.2 | W | W | W | W | W | W |
| 2013 | W | W | W | W | W | W | W | W | W | W | W | 175.8 |
| 2014 | W | W | 202.2 | 205.3 | 215.0 | 212.4 | 218.8 | 224.5 | 214.2 | 211.7 | 215.8 | W |
| 2015 | 201.7 | 191.5 | 206.1 | 227.7 | 214.3 | 207.2 | 219.5 | 218.6 | 236.3 | 221.3 | 218.0 | 232.7 |
| 2016 | 209.3 | 226.9 | 232.0 | 242.5 | W | 246.9 | 248.3 | W | 250.4 | 223.8 | 237.6 | 218.8 |
| 2017 | 192.0 | 209.3 | 239.3 | 311.1 | 293.6 | 315.5 | 314.3 | 304.9 | 266.2 | 231.2 | 230.1 | 230.1 |
| 2018 | 201.9 | 204.0 | 235.0 | 237.0 | 256.6 | 247.6 | 251.2 | 246.6 | 234.7 | 230.8 | 256.0 | 283.3 |
| 2019 | 225.8 | 255.9 | 260.8 | 254.8 | 265.1 | 263.9 | 274.0 | 270.8 | 269.1 | 271.7 | 256.3 | 260.2 |
| 2020 | 234.7 | 242.6 | 241.4 | 227.1 | 261.3 | 289.1 | 312.4 | 319.6 | 320.9 | 306.2 | 296.7 | 276.8 |
| 2021 | 262.7 | 228.4 | 261.3 | 297.2 | 299.1 | 308.8 | 304.7 | 306.2 | 307.0 | 317.1 | 313.8 | 287.6 |
| 2022 | 236.3 | 239.3 | 240.2 | |||||||||
| - = No Data Reported; -- = Not Applicable; NA = Not Available; W = Withheld to avoid disclosure of individual company data. |
| Release Date: 6/1/2022 |
| Next Release Date: TBD |