|
Download Data (XLS File) |
|
||||||||
|
||||||||
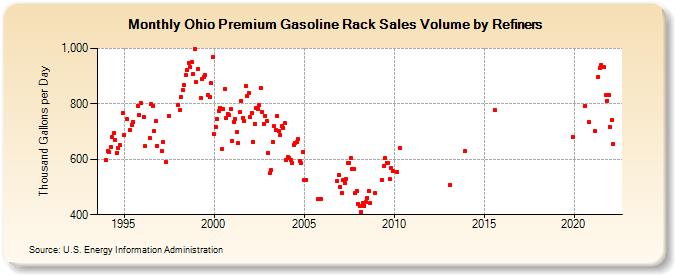
| Ohio Premium Gasoline Rack Sales Volume by Refiners (Thousand Gallons per Day) | ||||||||
| Year | Jan | Feb | Mar | Apr | May | Jun | Jul | Aug | Sep | Oct | Nov | Dec |
|---|---|---|---|---|---|---|---|---|---|---|---|---|
| 1994 | 595.6 | 631.0 | 625.5 | 645.0 | 679.5 | 694.1 | 669.2 | 624.3 | 641.8 | 652.1 | W | 766.8 |
| 1995 | 687.6 | W | 744.5 | W | 706.9 | 725.4 | 735.7 | W | W | 793.2 | 760.9 | 804.2 |
| 1996 | W | 754.0 | 646.4 | W | W | 677.3 | 798.9 | 793.9 | 702.7 | 738.8 | 649.1 | W |
| 1997 | W | 631.1 | 660.8 | W | 588.5 | W | 756.7 | W | W | W | W | W |
| 1998 | 794.4 | 777.3 | 825.8 | 849.3 | 868.1 | 905.0 | 923.7 | 948.5 | 932.0 | 950.5 | 907.1 | 996.1 |
| 1999 | 877.4 | 926.4 | W | 821.2 | 890.2 | 897.2 | 904.3 | W | 831.1 | 826.0 | 873.7 | 968.7 |
| 2000 | 689.4 | 717.2 | 746.9 | 774.8 | 785.0 | 637.3 | 779.8 | 853.9 | 748.7 | 764.6 | 759.7 | 780.5 |
| 2001 | 667.0 | 735.1 | 746.2 | 699.0 | 657.0 | 770.1 | 811.0 | 750.1 | 738.9 | 864.4 | 826.7 | 839.6 |
| 2002 | 753.3 | 768.6 | 661.7 | 728.0 | 786.5 | 780.3 | 794.5 | 857.8 | 769.8 | 728.9 | 755.0 | 736.8 |
| 2003 | 624.0 | 549.9 | 561.0 | 663.1 | 718.8 | 706.3 | 755.8 | 703.6 | 687.0 | 719.2 | 713.4 | 730.3 |
| 2004 | 595.9 | 609.9 | 605.7 | 596.4 | 587.1 | 651.6 | 660.2 | 661.3 | 671.7 | 593.4 | 585.2 | 627.1 |
| 2005 | 524.0 | 523.7 | W | W | W | W | W | W | W | 455.9 | W | 456.5 |
| 2006 | W | W | W | W | W | W | W | W | W | W | 521.2 | 544.8 |
| 2007 | 500.7 | 478.5 | 525.3 | 513.1 | 528.1 | 587.0 | 587.0 | 604.2 | 563.8 | 565.6 | 476.9 | 487.1 |
| 2008 | 438.8 | 432.8 | 408.9 | 443.8 | 431.9 | 444.2 | 461.8 | 486.5 | 441.3 | W | W | 477.4 |
| 2009 | W | W | W | W | 525.5 | 575.2 | 606.3 | 587.5 | 587.6 | 527.1 | 569.0 | 556.1 |
| 2010 | W | W | 553.5 | W | 640.2 | W | W | W | W | W | W | W |
| 2011 | W | W | W | W | W | W | W | W | W | W | W | W |
| 2012 | W | W | W | W | W | W | W | W | W | W | W | W |
| 2013 | W | 507.5 | W | W | W | W | W | W | W | W | W | 628.1 |
| 2014 | W | W | W | W | W | W | W | W | W | W | W | W |
| 2015 | W | W | W | W | W | W | W | 778.5 | W | W | W | W |
| 2016 | W | W | W | W | W | W | W | W | W | W | W | W |
| 2017 | W | W | W | W | W | W | W | W | W | W | W | W |
| 2018 | W | W | W | W | W | W | W | W | W | W | W | W |
| 2019 | W | W | W | W | W | W | W | W | W | W | W | 680.1 |
| 2020 | W | W | W | W | W | W | W | 792.7 | W | W | 733.2 | W |
| 2021 | W | W | 701.7 | W | 897.0 | 929.4 | 941.8 | W | 931.2 | 830.6 | 811.9 | 831.1 |
| 2022 | 718.2 | 743.4 | 654.6 | |||||||||
| - = No Data Reported; -- = Not Applicable; NA = Not Available; W = Withheld to avoid disclosure of individual company data. |
| Release Date: 6/1/2022 |
| Next Release Date: TBD |