|
Download Data (XLS File) |
|
||||||||
|
||||||||
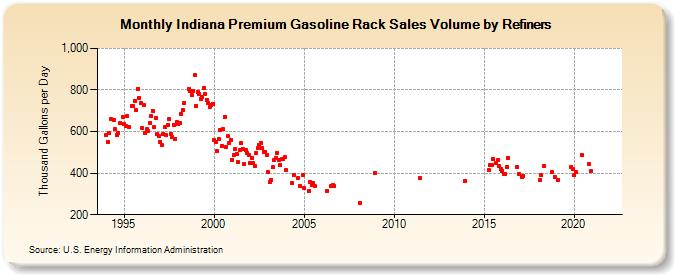
| Indiana Premium Gasoline Rack Sales Volume by Refiners (Thousand Gallons per Day) | ||||||||
| Year | Jan | Feb | Mar | Apr | May | Jun | Jul | Aug | Sep | Oct | Nov | Dec |
|---|---|---|---|---|---|---|---|---|---|---|---|---|
| 1994 | 584.9 | 551.8 | 593.4 | 658.2 | W | 655.4 | 610.7 | 583.3 | 593.8 | 641.0 | W | 670.2 |
| 1995 | 637.8 | 628.5 | 672.5 | 624.0 | W | 724.1 | 720.7 | 747.4 | 702.0 | 806.1 | 763.1 | 736.8 |
| 1996 | 617.7 | 728.3 | 593.8 | 611.0 | 603.1 | 643.5 | 672.7 | 700.5 | 621.1 | 666.7 | 586.9 | 578.9 |
| 1997 | 552.1 | 534.1 | 588.3 | 620.6 | 581.9 | 632.7 | 659.1 | 590.3 | 574.2 | 633.8 | 565.8 | 646.8 |
| 1998 | 636.9 | 642.5 | 685.1 | 703.1 | 738.0 | W | W | 804.8 | 796.9 | 775.8 | 795.7 | 870.6 |
| 1999 | 724.3 | 790.7 | 780.1 | 758.0 | 767.4 | 807.8 | 780.5 | 751.8 | 736.5 | 720.3 | 728.4 | 734.4 |
| 2000 | 559.1 | 549.1 | 505.2 | 563.6 | 605.8 | 531.9 | 611.0 | 672.4 | 525.0 | 578.6 | 546.8 | 557.8 |
| 2001 | 464.3 | 484.9 | 513.8 | 494.0 | 451.7 | 509.4 | 543.6 | 516.5 | 442.6 | 509.8 | 498.1 | 489.6 |
| 2002 | 448.7 | 474.5 | 450.5 | 436.7 | 498.7 | 520.0 | 536.0 | 544.6 | 521.2 | 503.4 | 504.0 | 488.0 |
| 2003 | 405.3 | 355.3 | 368.4 | 427.7 | 463.0 | 472.2 | 497.3 | 465.2 | 440.6 | 466.9 | 467.2 | 478.0 |
| 2004 | 415.2 | W | W | W | 350.2 | 390.1 | W | W | 378.0 | 338.3 | W | 389.2 |
| 2005 | 328.0 | W | W | 312.0 | 356.5 | 344.9 | 350.2 | 336.5 | W | W | W | W |
| 2006 | W | W | W | 315.4 | W | W | 339.6 | 341.9 | 337.9 | W | W | W |
| 2007 | W | W | W | W | W | W | W | W | W | W | W | W |
| 2008 | W | 258.7 | W | W | W | W | W | W | W | W | W | 398.7 |
| 2009 | W | W | W | W | W | W | W | W | W | W | W | W |
| 2010 | W | W | W | W | W | W | W | W | W | W | W | W |
| 2011 | W | W | W | W | W | 374.8 | W | W | W | W | W | W |
| 2012 | W | W | W | W | W | W | W | W | W | W | W | W |
| 2013 | W | W | W | W | W | W | W | W | W | W | W | 363.1 |
| 2014 | W | W | W | W | W | W | W | W | W | W | W | W |
| 2015 | W | W | W | 413.8 | 436.9 | 439.7 | 467.3 | W | 448.7 | 462.5 | 434.3 | 417.5 |
| 2016 | 411.5 | 395.7 | 397.0 | 431.0 | 472.2 | W | W | W | W | W | 427.9 | 397.3 |
| 2017 | W | 380.3 | 387.9 | W | W | W | W | W | W | W | W | W |
| 2018 | W | 367.9 | 390.7 | W | 432.8 | W | W | W | W | 405.0 | W | 382.2 |
| 2019 | W | 369.1 | W | W | W | W | W | W | W | W | 428.0 | 417.6 |
| 2020 | 389.4 | 403.3 | W | W | W | 484.9 | W | W | W | W | 441.8 | 409.5 |
| 2021 | W | W | W | W | W | W | W | W | W | W | W | W |
| 2022 | W | W | W | |||||||||
| - = No Data Reported; -- = Not Applicable; NA = Not Available; W = Withheld to avoid disclosure of individual company data. |
| Release Date: 6/1/2022 |
| Next Release Date: TBD |