|
Download Data (XLS File) |
|
||||||||
|
||||||||
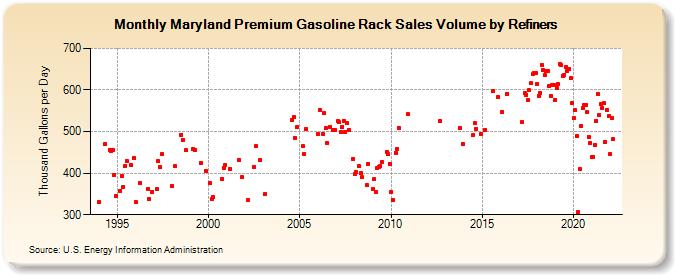
| Maryland Premium Gasoline Rack Sales Volume by Refiners (Thousand Gallons per Day) | ||||||||
| Year | Jan | Feb | Mar | Apr | May | Jun | Jul | Aug | Sep | Oct | Nov | Dec |
|---|---|---|---|---|---|---|---|---|---|---|---|---|
| 1994 | 330.9 | W | W | W | 469.6 | W | W | 456.7 | 453.6 | 454.5 | 396.4 | 345.5 |
| 1995 | W | W | 358.0 | 393.2 | 367.4 | 417.7 | 429.8 | W | W | 418.5 | W | 436.7 |
| 1996 | 330.8 | W | W | 376.7 | W | W | W | W | 362.1 | 338.5 | W | 355.4 |
| 1997 | W | W | 361.5 | 428.2 | 413.9 | 445.4 | W | W | W | W | W | W |
| 1998 | 368.7 | W | 416.1 | W | W | W | 492.9 | 480.7 | W | 454.7 | W | W |
| 1999 | W | W | 458.4 | 454.5 | W | W | W | 425.3 | W | W | 405.9 | W |
| 2000 | W | 375.2 | 336.8 | 343.0 | W | W | W | W | W | 386.6 | 413.1 | 419.6 |
| 2001 | W | W | 410.9 | W | W | W | W | W | 431.4 | W | 390.1 | W |
| 2002 | W | W | 335.3 | W | W | W | 415.5 | 464.5 | W | W | 432.4 | W |
| 2003 | W | 349.5 | W | W | W | W | W | W | W | W | W | W |
| 2004 | W | W | W | W | W | W | W | 527.7 | 534.1 | 485.5 | 510.9 | W |
| 2005 | W | W | 464.2 | 446.2 | 506.2 | W | W | W | W | W | W | W |
| 2006 | 494.5 | 552.7 | W | 493.8 | 543.5 | 508.3 | 472.6 | W | 511.3 | W | 502.9 | 503.2 |
| 2007 | W | 524.3 | 521.8 | 498.9 | 512.0 | 526.3 | 500.1 | 521.5 | 503.5 | W | W | 434.7 |
| 2008 | 396.8 | 402.2 | W | 416.7 | 400.4 | 389.7 | W | W | 370.7 | 422.7 | W | W |
| 2009 | 361.7 | 384.9 | 354.5 | 411.3 | 415.6 | 416.9 | 427.6 | W | W | 451.5 | 445.7 | 420.9 |
| 2010 | 355.6 | 335.6 | W | 449.4 | 458.7 | 508.7 | W | W | W | W | W | 542.1 |
| 2011 | W | W | W | W | W | W | W | W | W | W | W | W |
| 2012 | W | W | W | W | W | W | W | W | 524.8 | W | W | W |
| 2013 | W | W | W | W | W | W | W | W | W | 508.5 | W | 470.7 |
| 2014 | W | W | W | W | W | W | 492.6 | 519.8 | 507.0 | W | W | 493.4 |
| 2015 | W | W | 503.9 | W | W | W | W | 597.1 | W | W | 583.3 | W |
| 2016 | W | 547.3 | W | W | 590.4 | W | W | W | W | W | W | W |
| 2017 | W | W | 522.7 | W | 591.6 | 588.8 | 574.7 | 599.2 | 615.6 | 638.4 | 640.8 | 640.6 |
| 2018 | 613.3 | 586.0 | 593.5 | 661.1 | 648.9 | 636.0 | 646.0 | 645.7 | 608.7 | 585.8 | 612.9 | 613.0 |
| 2019 | 576.9 | 603.7 | 613.6 | 662.8 | 659.2 | 634.3 | 637.1 | 655.3 | 646.2 | 649.9 | 627.7 | 567.6 |
| 2020 | 532.2 | 551.6 | 489.0 | 306.5 | 408.9 | 512.2 | 556.2 | 563.7 | 564.0 | 546.8 | 486.4 | 472.6 |
| 2021 | 438.8 | 438.9 | 468.6 | 525.6 | 590.9 | 539.5 | 566.0 | 556.8 | 567.8 | 475.6 | 552.6 | 537.0 |
| 2022 | 445.8 | 531.6 | 481.8 | |||||||||
| - = No Data Reported; -- = Not Applicable; NA = Not Available; W = Withheld to avoid disclosure of individual company data. |
| Release Date: 6/1/2022 |
| Next Release Date: TBD |