|
Download Data (XLS File) |
|
||||||||
|
||||||||
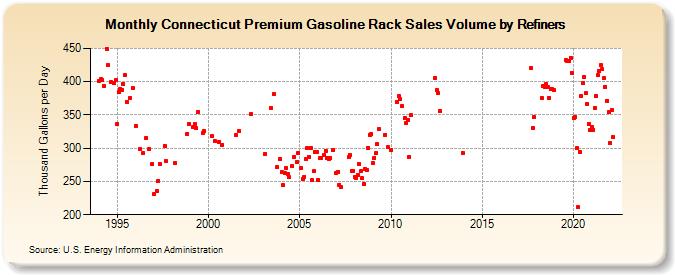
| Connecticut Premium Gasoline Rack Sales Volume by Refiners (Thousand Gallons per Day) | ||||||||
| Year | Jan | Feb | Mar | Apr | May | Jun | Jul | Aug | Sep | Oct | Nov | Dec |
|---|---|---|---|---|---|---|---|---|---|---|---|---|
| 1994 | 401.5 | 403.9 | 402.1 | 394.0 | W | 449.3 | 424.9 | W | 398.9 | W | 397.6 | 401.8 |
| 1995 | 336.7 | 384.8 | 389.4 | 387.6 | 396.2 | 409.8 | 370.1 | W | 375.3 | W | 389.8 | W |
| 1996 | 334.0 | W | W | 298.9 | W | 292.5 | W | 316.0 | W | 299.4 | W | 275.5 |
| 1997 | 230.9 | W | 235.7 | 251.3 | 276.1 | W | W | 303.7 | 280.4 | W | W | W |
| 1998 | W | W | 277.0 | W | W | W | W | W | W | W | 321.8 | 336.7 |
| 1999 | W | W | 332.2 | 336.8 | 330.0 | 354.8 | W | W | 322.9 | 325.7 | W | W |
| 2000 | W | W | 317.9 | W | 310.5 | W | W | 309.5 | W | 305.5 | W | W |
| 2001 | W | W | W | W | W | W | 319.4 | W | 325.4 | W | W | W |
| 2002 | W | W | W | W | 351.3 | W | W | W | W | W | W | W |
| 2003 | W | 291.3 | W | W | W | 360.3 | W | 381.4 | W | 271.9 | W | 284.0 |
| 2004 | 264.6 | 244.5 | 262.5 | 270.5 | 261.4 | 256.1 | W | 272.7 | 287.0 | W | 279.9 | 292.6 |
| 2005 | W | 269.5 | 254.3 | 257.3 | 284.0 | 300.1 | 287.2 | 300.6 | 251.7 | 265.2 | 294.5 | 293.9 |
| 2006 | 252.6 | 284.7 | 285.4 | W | 290.0 | 295.9 | 284.5 | 283.8 | 284.9 | W | 298.0 | W |
| 2007 | 263.2 | 264.6 | 245.1 | 241.2 | W | W | W | W | 286.2 | 289.3 | 265.6 | 265.5 |
| 2008 | 256.8 | 255.3 | 260.4 | 276.5 | 265.1 | 254.5 | 246.2 | 268.5 | 267.5 | 300.9 | 320.5 | 321.6 |
| 2009 | 278.3 | 285.9 | 292.2 | 306.1 | 328.6 | W | W | W | 320.5 | W | 301.6 | W |
| 2010 | 297.8 | W | W | W | 370.1 | 377.8 | 373.6 | 363.4 | W | 345.9 | 338.4 | 342.7 |
| 2011 | 286.5 | 349.5 | W | W | W | W | W | W | W | W | W | W |
| 2012 | W | W | W | W | W | 405.6 | 387.1 | 382.4 | 355.6 | W | W | W |
| 2013 | W | W | W | W | W | W | W | W | W | W | W | 292.9 |
| 2014 | W | W | W | W | W | W | W | W | W | W | W | W |
| 2015 | W | W | W | W | W | W | W | W | W | W | W | W |
| 2016 | W | W | W | W | W | W | W | W | W | W | W | W |
| 2017 | W | W | W | W | W | W | W | W | 420.4 | 330.7 | 347.3 | W |
| 2018 | W | W | W | 376.1 | 392.9 | 391.8 | 396.5 | 391.3 | 376.0 | 389.0 | 388.8 | 387.1 |
| 2019 | W | W | W | W | W | W | W | 432.2 | 431.7 | 431.1 | 436.3 | 413.7 |
| 2020 | 345.6 | 346.8 | 300.0 | 210.9 | 294.9 | 378.1 | 397.9 | 407.6 | 382.2 | 366.8 | 336.4 | 327.9 |
| 2021 | 331.2 | 327.9 | 360.6 | 378.7 | 409.6 | 415.6 | 424.6 | 418.5 | 405.8 | 392.4 | 371.5 | 354.2 |
| 2022 | 307.9 | 357.5 | 316.7 | |||||||||
| - = No Data Reported; -- = Not Applicable; NA = Not Available; W = Withheld to avoid disclosure of individual company data. |
| Release Date: 6/1/2022 |
| Next Release Date: TBD |