|
Download Data (XLS File) |
|
||||||||
|
||||||||
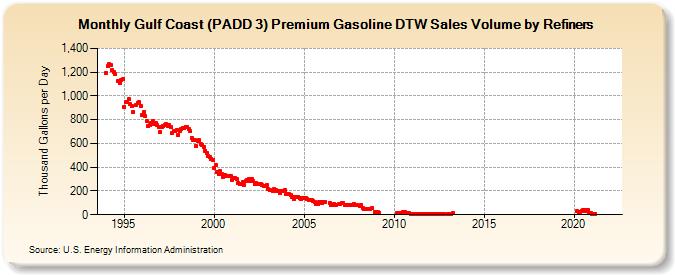
| Gulf Coast (PADD 3) Premium Gasoline DTW Sales Volume by Refiners (Thousand Gallons per Day) | ||||||||
| Year | Jan | Feb | Mar | Apr | May | Jun | Jul | Aug | Sep | Oct | Nov | Dec |
|---|---|---|---|---|---|---|---|---|---|---|---|---|
| 1994 | 1,192.6 | 1,251.6 | 1,269.0 | 1,258.6 | 1,221.0 | 1,204.9 | 1,182.6 | W | 1,129.2 | 1,106.5 | 1,133.7 | 1,139.2 |
| 1995 | 907.8 | 950.1 | 947.5 | 970.6 | 929.6 | 914.7 | 867.4 | W | 922.1 | 943.6 | 946.0 | 916.7 |
| 1996 | 838.5 | 861.8 | 834.6 | 789.4 | 745.5 | 756.5 | 774.8 | 785.9 | 762.7 | 769.8 | 756.0 | 738.2 |
| 1997 | 694.2 | 735.0 | 746.6 | 755.1 | 760.9 | 748.8 | 755.0 | 737.2 | 686.3 | 707.4 | 702.4 | 714.7 |
| 1998 | 672.2 | 700.7 | 720.9 | 727.9 | 733.2 | 738.4 | 735.4 | 725.6 | 702.0 | 646.8 | 626.5 | 632.6 |
| 1999 | 575.8 | 624.5 | 626.4 | 591.9 | 588.3 | 570.3 | 539.8 | 522.5 | 498.0 | 485.4 | 471.1 | 460.6 |
| 2000 | 391.2 | 420.3 | 359.4 | 340.6 | 365.5 | 342.2 | 321.6 | 335.0 | 324.8 | 322.5 | 324.9 | 325.6 |
| 2001 | 295.8 | 307.3 | 307.2 | 297.6 | 269.1 | 257.4 | 255.6 | 271.2 | 253.6 | 283.1 | 295.3 | 301.9 |
| 2002 | 284.3 | 301.7 | 281.0 | 258.5 | 271.1 | 260.8 | 260.5 | 261.8 | 249.5 | 242.3 | 244.6 | 247.3 |
| 2003 | 219.6 | 204.4 | W | 199.8 | 214.1 | 207.3 | 200.1 | 195.7 | 181.2 | 200.4 | 199.0 | 207.8 |
| 2004 | 177.7 | 177.0 | 172.8 | 164.0 | 148.7 | 130.3 | 147.4 | 151.2 | 152.2 | 136.5 | 134.5 | 144.5 |
| 2005 | 138.6 | 139.9 | 129.4 | 121.5 | 124.4 | 121.6 | 113.6 | 105.5 | 86.8 | 90.7 | 103.7 | 106.1 |
| 2006 | 102.5 | 110.2 | 105.2 | W | W | 99.9 | 84.0 | 84.4 | 93.4 | 83.0 | W | 91.1 |
| 2007 | 88.0 | 96.7 | 94.9 | 85.9 | 83.0 | 82.2 | 78.5 | 85.0 | 85.5 | 90.5 | 80.9 | 81.0 |
| 2008 | W | 70.8 | 82.9 | 56.3 | 51.4 | 47.6 | 46.2 | 46.3 | 52.2 | 53.4 | NA | 24.1 |
| 2009 | 17.5 | 19.5 | 16.7 | W | W | W | W | W | W | W | W | W |
| 2010 | W | W | 15.5 | 16.5 | 18.0 | 17.6 | 21.0 | 21.7 | 18.1 | 11.6 | 11.3 | 10.0 |
| 2011 | 8.5 | 7.0 | 7.1 | 6.6 | 6.8 | 8.8 | 9.3 | 9.5 | 8.2 | 9.0 | 8.2 | 7.0 |
| 2012 | 7.3 | 6.7 | 6.4 | 7.3 | 8.0 | 7.2 | 8.1 | W | 8.8 | 9.5 | W | W |
| 2013 | 9.0 | 9.4 | 8.3 | 12.8 | W | W | W | W | W | W | W | W |
| 2014 | W | W | W | W | W | W | W | W | W | W | W | W |
| 2015 | W | W | W | W | W | W | W | W | W | W | W | W |
| 2016 | W | W | W | W | W | W | W | W | W | W | W | W |
| 2017 | W | W | W | W | W | W | W | W | W | W | W | W |
| 2018 | W | W | W | W | W | W | W | W | W | W | W | W |
| 2019 | W | W | W | W | W | W | W | W | W | W | W | W |
| 2020 | W | W | 29.0 | 17.2 | 25.5 | 34.7 | 37.1 | 35.2 | 36.1 | 35.7 | 13.1 | 12.8 |
| 2021 | 8.2 | W | 8.7 | W | W | W | W | W | W | W | W | W |
| 2022 | W | W | W | |||||||||
| - = No Data Reported; -- = Not Applicable; NA = Not Available; W = Withheld to avoid disclosure of individual company data. |
| Release Date: 6/1/2022 |
| Next Release Date: TBD |