|
Download Data (XLS File) |
|
||||||||
|
||||||||
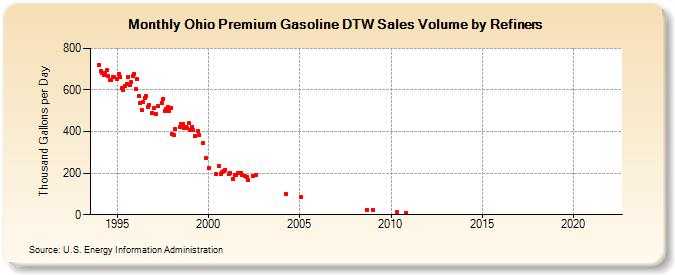
| Ohio Premium Gasoline DTW Sales Volume by Refiners (Thousand Gallons per Day) | ||||||||
| Year | Jan | Feb | Mar | Apr | May | Jun | Jul | Aug | Sep | Oct | Nov | Dec |
|---|---|---|---|---|---|---|---|---|---|---|---|---|
| 1994 | 722.0 | 690.1 | 681.4 | 673.5 | 682.6 | 694.3 | 666.9 | 645.8 | 648.8 | 662.4 | 661.1 | W |
| 1995 | 653.2 | 676.5 | 663.3 | 608.8 | 597.6 | 619.2 | 627.3 | 664.7 | 623.2 | 637.9 | 666.0 | 677.3 |
| 1996 | 603.8 | 650.4 | 569.3 | 535.3 | 502.6 | 541.7 | 560.2 | 569.9 | 515.7 | 527.4 | W | 491.4 |
| 1997 | 511.6 | 484.7 | W | 522.6 | W | 539.7 | 558.2 | 498.5 | 506.6 | 518.7 | 497.0 | 512.6 |
| 1998 | 389.6 | 383.2 | 411.4 | W | W | 422.0 | 436.0 | 438.1 | 416.1 | 422.6 | 417.2 | 440.4 |
| 1999 | 405.6 | 422.2 | 407.4 | 376.4 | W | 404.9 | 383.5 | W | 345.1 | W | 271.0 | W |
| 2000 | 225.4 | W | W | W | W | 194.6 | W | 232.2 | 197.2 | 205.4 | 208.2 | 216.0 |
| 2001 | W | 193.9 | 201.9 | W | 174.0 | 191.2 | 190.5 | 199.5 | W | 199.5 | 191.0 | W |
| 2002 | 186.1 | 182.3 | 166.3 | W | W | 184.3 | W | 192.9 | W | W | W | W |
| 2003 | W | W | W | W | W | W | W | W | W | W | W | W |
| 2004 | W | W | W | 98.0 | W | W | W | W | W | W | W | W |
| 2005 | W | 84.0 | W | W | W | W | W | W | W | W | W | W |
| 2006 | W | W | W | W | W | W | W | W | W | W | W | W |
| 2007 | W | W | W | W | W | W | W | W | W | W | W | W |
| 2008 | W | W | W | W | W | W | W | W | 23.9 | W | W | W |
| 2009 | 22.7 | W | W | W | W | W | W | W | W | W | W | W |
| 2010 | W | W | W | W | 10.7 | W | W | W | W | W | 7.2 | W |
| 2011 | W | W | W | W | W | W | W | W | W | W | W | W |
| 2012 | W | W | W | W | W | W | W | W | W | W | W | W |
| 2013 | W | W | W | - | - | - | - | - | - | - | - | - |
| 2014 | - | - | - | - | - | - | - | - | - | - | - | - |
| 2015 | - | - | - | - | - | - | - | - | - | - | - | - |
| 2016 | - | - | - | - | - | - | - | - | - | - | - | - |
| 2017 | - | - | - | - | - | - | - | - | - | - | - | - |
| 2018 | - | - | - | - | - | - | - | - | - | - | - | - |
| 2019 | - | - | - | - | - | - | - | - | - | - | - | - |
| 2020 | - | - | - | - | - | - | - | - | - | - | - | - |
| 2021 | - | - | - | - | - | - | - | - | - | - | - | - |
| 2022 | - | - | - | |||||||||
| - = No Data Reported; -- = Not Applicable; NA = Not Available; W = Withheld to avoid disclosure of individual company data. |
| Release Date: 6/1/2022 |
| Next Release Date: TBD |