|
Download Data (XLS File) |
|
||||||||
|
||||||||
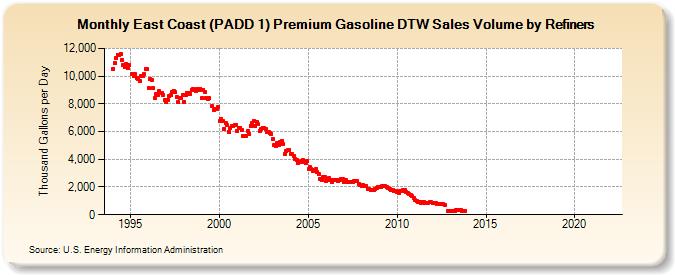
| East Coast (PADD 1) Premium Gasoline DTW Sales Volume by Refiners (Thousand Gallons per Day) | ||||||||
| Year | Jan | Feb | Mar | Apr | May | Jun | Jul | Aug | Sep | Oct | Nov | Dec |
|---|---|---|---|---|---|---|---|---|---|---|---|---|
| 1994 | 10,543.4 | 10,944.0 | 11,324.6 | 11,547.6 | 11,542.9 | 11,574.4 | 11,151.8 | 10,799.1 | 10,640.2 | 10,878.7 | 10,559.2 | 10,809.5 |
| 1995 | W | 10,127.3 | 9,997.5 | 10,145.0 | 9,871.2 | 9,767.5 | 9,666.9 | 9,992.6 | 10,011.5 | 10,139.0 | 10,548.8 | 10,487.0 |
| 1996 | 9,154.0 | 9,806.0 | 9,720.1 | 9,166.6 | 8,409.7 | 8,686.6 | 8,618.0 | 8,922.7 | 8,775.7 | 8,792.9 | 8,661.6 | 8,266.8 |
| 1997 | 8,098.6 | 8,303.2 | 8,559.9 | 8,632.3 | 8,818.6 | 8,933.3 | 8,847.9 | 8,474.1 | 8,103.4 | 8,438.6 | 8,441.0 | 8,655.6 |
| 1998 | 8,165.5 | 8,604.8 | 8,765.0 | 8,781.4 | 8,744.3 | 9,009.6 | 9,094.5 | 9,006.8 | 8,931.6 | 9,078.4 | 9,002.7 | 9,102.4 |
| 1999 | 8,413.1 | 9,013.1 | 8,870.4 | 8,398.5 | 8,360.4 | 8,404.0 | W | 7,813.4 | 7,579.4 | 7,609.7 | 7,619.3 | 7,789.4 |
| 2000 | 6,747.0 | 6,913.3 | 6,728.9 | 6,206.1 | 6,625.3 | 6,437.2 | 5,990.9 | 6,264.9 | 6,382.1 | 6,424.2 | 6,464.0 | 6,483.8 |
| 2001 | 6,031.7 | 6,227.5 | 6,257.3 | 6,136.8 | 5,713.3 | 5,677.2 | 5,696.0 | 6,067.9 | 5,836.3 | 6,400.8 | 6,587.5 | 6,777.4 |
| 2002 | 6,377.9 | 6,704.6 | 6,528.1 | 6,024.9 | 6,152.6 | 6,285.0 | 6,221.6 | 6,184.8 | 5,935.8 | 5,935.7 | 5,913.1 | 5,812.7 |
| 2003 | 5,468.1 | 5,048.4 | 4,977.2 | 5,142.1 | 5,062.4 | 5,222.7 | 5,333.0 | 5,099.5 | 4,391.9 | 4,583.9 | 4,640.7 | 4,685.7 |
| 2004 | 4,397.3 | 4,363.7 | 4,240.3 | 4,050.1 | 3,962.9 | 3,725.0 | 3,778.9 | 3,861.6 | 3,945.8 | 3,787.1 | 3,713.9 | 3,858.6 |
| 2005 | 3,285.7 | 3,413.4 | 3,304.5 | 3,131.7 | 3,206.9 | 3,314.9 | 3,069.9 | 2,905.0 | 2,599.1 | 2,497.6 | 2,708.6 | 2,745.0 |
| 2006 | 2,452.9 | 2,513.4 | 2,640.0 | 2,482.7 | 2,384.1 | 2,498.3 | 2,499.1 | 2,480.8 | 2,400.2 | 2,524.2 | 2,567.6 | 2,557.9 |
| 2007 | 2,395.1 | 2,495.5 | 2,383.8 | 2,333.9 | 2,387.2 | 2,332.5 | 2,333.2 | 2,406.2 | 2,414.0 | 2,412.9 | 2,235.2 | 2,177.0 |
| 2008 | 2,069.0 | 2,111.1 | 2,063.6 | 2,087.0 | 1,885.1 | 1,834.9 | 1,776.2 | 1,778.1 | 1,815.7 | 1,890.4 | 1,951.1 | 2,018.5 |
| 2009 | 1,975.5 | 2,012.8 | 2,039.6 | 2,069.1 | 2,063.0 | 1,966.4 | 1,927.5 | 1,864.5 | 1,813.3 | 1,807.8 | 1,693.6 | 1,744.2 |
| 2010 | 1,618.2 | 1,576.1 | 1,700.0 | 1,733.3 | 1,768.4 | 1,784.9 | 1,673.0 | 1,540.5 | 1,459.6 | 1,398.5 | 1,320.6 | 1,232.8 |
| 2011 | 1,044.4 | 988.2 | 939.4 | 881.6 | 844.7 | 885.5 | 919.1 | 874.4 | 869.3 | 878.7 | 882.0 | 896.7 |
| 2012 | 830.8 | 836.4 | 817.2 | 760.5 | 737.6 | 781.5 | 778.9 | 754.3 | 726.7 | W | 248.1 | 266.8 |
| 2013 | 271.1 | 276.1 | 279.0 | 280.0 | 308.1 | 324.1 | 332.2 | 317.9 | 291.4 | 288.5 | 298.1 | W |
| 2014 | W | W | W | W | W | W | W | W | W | W | W | W |
| 2015 | W | W | W | W | W | W | W | W | W | W | W | W |
| 2016 | W | W | W | W | W | W | W | W | W | W | W | W |
| 2017 | W | W | W | W | W | W | W | W | W | W | W | W |
| 2018 | W | W | W | W | W | W | W | W | W | W | W | W |
| 2019 | W | W | W | W | W | W | W | W | W | W | W | W |
| 2020 | W | W | W | W | W | W | W | W | W | W | W | W |
| 2021 | W | W | W | W | W | W | W | W | W | W | W | W |
| 2022 | W | W | W | |||||||||
| - = No Data Reported; -- = Not Applicable; NA = Not Available; W = Withheld to avoid disclosure of individual company data. |
| Release Date: 6/1/2022 |
| Next Release Date: TBD |