|
Download Data (XLS File) |
|
||||||||
|
||||||||
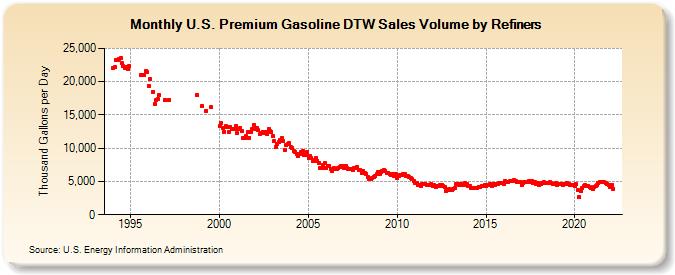
| U.S. Premium Gasoline DTW Sales Volume by Refiners (Thousand Gallons per Day) | ||||||||
| Year | Jan | Feb | Mar | Apr | May | Jun | Jul | Aug | Sep | Oct | Nov | Dec |
|---|---|---|---|---|---|---|---|---|---|---|---|---|
| 1994 | 22,061.2 | 22,159.9 | 23,237.8 | 23,324.5 | 23,382.7 | 23,551.7 | 22,795.3 | 22,284.6 | 22,020.7 | 22,155.9 | 21,849.0 | 22,352.2 |
| 1995 | W | W | W | W | W | W | W | 21,013.2 | W | 21,045.5 | 21,552.2 | 21,416.9 |
| 1996 | 19,393.1 | 20,389.9 | W | 18,508.0 | 16,614.9 | 17,283.9 | 17,429.4 | 17,998.4 | W | W | W | 17,195.2 |
| 1997 | W | W | 17,239.9 | W | W | W | W | W | W | W | W | W |
| 1998 | W | W | W | W | W | W | W | W | W | 17,968.1 | W | W |
| 1999 | 16,310.5 | W | W | 15,635.5 | W | W | 16,125.9 | W | W | W | W | W |
| 2000 | 13,387.5 | 13,728.6 | 13,009.6 | 12,475.6 | 13,263.0 | 13,126.4 | 12,457.2 | 13,176.2 | 12,852.1 | 12,819.2 | 12,942.5 | 13,355.2 |
| 2001 | 12,220.9 | 12,817.5 | 12,980.0 | 12,511.2 | 11,480.5 | 11,532.5 | 11,773.4 | 12,376.7 | 11,552.5 | 12,426.4 | 12,881.0 | 13,447.0 |
| 2002 | 12,865.8 | 13,092.3 | 12,682.9 | 12,057.0 | 12,322.4 | 12,497.4 | 12,267.5 | 12,488.2 | 12,117.4 | 12,889.1 | 12,564.6 | 12,454.9 |
| 2003 | 11,799.9 | 11,050.3 | 10,186.0 | 10,653.0 | 10,921.2 | 11,295.1 | 11,521.4 | 11,073.3 | 9,770.9 | 10,450.9 | 10,590.3 | 10,709.5 |
| 2004 | 10,143.8 | 10,047.9 | 9,585.7 | 9,390.3 | 9,106.4 | 8,753.9 | 9,161.9 | 9,390.9 | 9,565.4 | 8,985.7 | 8,966.7 | 9,407.3 |
| 2005 | 8,510.3 | 8,762.9 | 8,527.6 | 8,045.0 | 8,262.3 | 8,589.5 | 8,083.4 | 7,786.8 | 6,997.7 | 6,990.8 | 7,469.8 | 7,715.7 |
| 2006 | 7,076.5 | 7,330.3 | 7,363.7 | 6,911.8 | 6,594.0 | 6,958.1 | 6,859.0 | 6,930.1 | 6,955.2 | 7,224.9 | 7,288.2 | 7,334.1 |
| 2007 | 7,005.0 | 7,323.8 | 7,036.1 | 6,844.6 | 6,826.6 | 6,821.2 | 6,772.8 | 7,070.5 | 6,951.5 | 7,142.6 | 6,686.8 | 6,691.8 |
| 2008 | 6,252.4 | 6,537.8 | 6,277.9 | 6,129.5 | 5,739.0 | 5,431.1 | 5,351.9 | 5,548.2 | 5,737.2 | 5,849.1 | 6,067.3 | 6,466.9 |
| 2009 | 6,141.5 | 6,347.5 | 6,584.6 | 6,659.8 | 6,621.1 | 6,274.1 | 6,313.6 | 6,099.1 | 6,028.1 | 6,070.4 | 5,869.9 | 6,072.0 |
| 2010 | 5,467.8 | 5,793.4 | 5,929.2 | 5,927.0 | 6,186.0 | 6,149.2 | 5,881.7 | 5,755.5 | 5,713.9 | 5,492.7 | 5,305.7 | 5,077.8 |
| 2011 | 4,719.4 | 4,760.3 | 4,446.6 | 4,402.6 | 4,372.4 | 4,556.3 | 4,656.1 | 4,661.6 | 4,498.4 | 4,506.9 | 4,452.2 | 4,629.7 |
| 2012 | 4,332.7 | 4,437.1 | 4,227.0 | 4,281.8 | 4,308.5 | 4,416.9 | 4,404.2 | 4,315.0 | 4,230.0 | 3,603.0 | 3,744.1 | 3,835.7 |
| 2013 | 3,766.0 | 3,750.2 | 3,920.9 | 4,040.4 | 4,560.3 | 4,626.6 | 4,467.7 | 4,650.3 | 4,494.1 | 4,533.8 | 4,705.3 | 4,551.9 |
| 2014 | 4,309.5 | 4,295.7 | 4,033.7 | 3,979.2 | 4,087.2 | 4,048.7 | 4,004.8 | 4,210.8 | 4,178.9 | 4,321.5 | 4,314.5 | 4,402.1 |
| 2015 | 4,366.4 | 4,465.6 | 4,460.7 | 4,553.8 | 4,366.9 | 4,545.7 | 4,392.2 | 4,572.9 | 4,663.6 | 4,705.5 | 4,692.5 | 4,741.8 |
| 2016 | 4,578.0 | 5,045.3 | 4,938.0 | 4,965.8 | 5,028.5 | 5,004.9 | 5,010.9 | 5,190.8 | 5,044.3 | 4,900.4 | 4,851.3 | 4,918.8 |
| 2017 | 4,536.1 | 4,709.8 | 4,928.0 | 4,932.6 | 4,977.8 | 4,994.8 | 4,992.2 | 5,052.4 | 4,833.2 | 4,909.5 | 4,642.8 | 4,768.0 |
| 2018 | 4,491.8 | 4,683.9 | 4,700.3 | 4,851.0 | 4,766.3 | 4,774.1 | 4,777.5 | 4,893.8 | 4,766.5 | 4,666.2 | 4,665.5 | 4,736.2 |
| 2019 | 4,445.0 | 4,635.9 | 4,621.4 | 4,617.0 | 4,540.4 | 4,686.3 | 4,622.1 | 4,833.8 | 4,685.9 | 4,456.7 | 4,423.4 | 4,444.3 |
| 2020 | 4,372.5 | 4,578.0 | 3,654.6 | 2,646.7 | 3,558.4 | 4,080.2 | 4,247.1 | 4,408.3 | 4,376.9 | 4,384.9 | 4,211.2 | 3,992.8 |
| 2021 | 3,874.3 | 4,102.4 | 4,263.5 | 4,494.6 | 4,729.2 | 4,974.6 | 4,971.4 | 4,882.4 | 4,869.4 | 4,713.9 | 4,595.7 | 4,479.1 |
| 2022 | 4,119.2 | 4,452.9 | 3,865.2 | |||||||||
| - = No Data Reported; -- = Not Applicable; NA = Not Available; W = Withheld to avoid disclosure of individual company data. |
| Release Date: 6/1/2022 |
| Next Release Date: TBD |