|
Download Data (XLS File) |
|
||||||||
|
||||||||
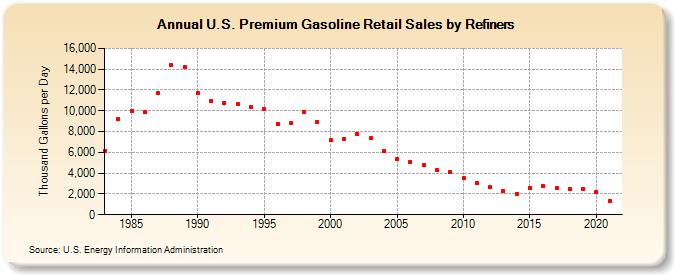
| U.S. Premium Gasoline Retail Sales by Refiners (Thousand Gallons per Day) | ||||||||
| Decade | Year-0 | Year-1 | Year-2 | Year-3 | Year-4 | Year-5 | Year-6 | Year-7 | Year-8 | Year-9 |
|---|---|---|---|---|---|---|---|---|---|---|
| 1980's | 6,165.5 | 9,208.2 | 9,988.8 | 9,874.2 | 11,670.8 | 14,417.5 | 14,194.0 | |||
| 1990's | 11,682.8 | 10,926.2 | 10,762.9 | 10,647.6 | 10,348.8 | 10,173.4 | 8,757.0 | 8,810.2 | 9,876.0 | 8,922.1 |
| 2000's | 7,142.7 | 7,316.0 | 7,754.3 | 7,334.7 | 6,094.0 | 5,395.0 | 5,080.4 | 4,822.4 | 4,297.7 | 4,099.8 |
| 2010's | 3,544.0 | 3,027.0 | 2,622.4 | 2,270.3 | 2,035.2 | 2,616.3 | 2,748.1 | 2,565.0 | 2,464.6 | 2,495.6 |
| 2020's | 2,155.5 |
| - = No Data Reported; -- = Not Applicable; NA = Not Available; W = Withheld to avoid disclosure of individual company data. |
| Release Date: 6/1/2022 |
| Next Release Date: TBD |