|
Download Data (XLS File) |
|
||||||||
|
||||||||
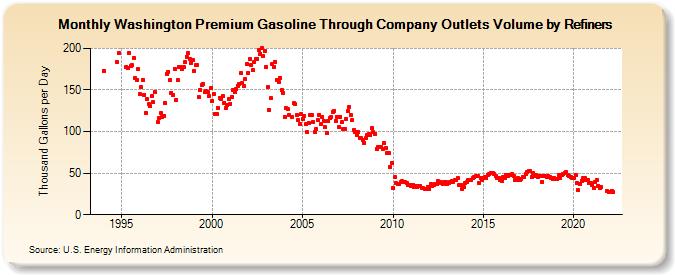
| Washington Premium Gasoline Through Company Outlets Volume by Refiners (Thousand Gallons per Day) | ||||||||
| Year | Jan | Feb | Mar | Apr | May | Jun | Jul | Aug | Sep | Oct | Nov | Dec |
|---|---|---|---|---|---|---|---|---|---|---|---|---|
| 1993 | W | W | W | |||||||||
| 1994 | 173.1 | W | W | W | W | W | W | W | W | 183.1 | 194.7 | W |
| 1995 | W | W | W | 178.2 | 176.1 | 194.8 | 179.0 | 179.5 | 188.8 | 164.3 | 162.1 | 174.9 |
| 1996 | 145.6 | 153.0 | 162.5 | 144.4 | 122.5 | 138.9 | 132.8 | 130.2 | 143.0 | 135.0 | 148.0 | NA |
| 1997 | 111.0 | 116.6 | 122.3 | 117.9 | 119.0 | 134.3 | 169.3 | 172.2 | 161.9 | 146.7 | 143.9 | 175.6 |
| 1998 | 138.1 | 161.7 | 177.1 | 178.1 | 175.3 | 177.4 | 183.2 | 189.7 | 194.0 | 187.8 | 182.4 | 186.5 |
| 1999 | 173.4 | 179.9 | 179.8 | 141.5 | 150.0 | 155.8 | 157.3 | 147.5 | 148.3 | 147.5 | 142.8 | 152.4 |
| 2000 | 137.1 | 144.6 | 121.5 | 120.6 | 128.2 | 140.1 | 139.1 | 142.6 | 134.9 | 128.6 | 131.5 | 138.9 |
| 2001 | 133.7 | 141.4 | 150.0 | 147.9 | 151.6 | 155.2 | 157.5 | 170.1 | 158.2 | 154.5 | 163.0 | 181.0 |
| 2002 | 170.8 | 187.2 | 180.2 | 173.6 | 184.2 | 187.3 | 187.4 | 198.3 | 193.7 | 199.9 | 190.9 | 196.3 |
| 2003 | 177.8 | 153.1 | 125.9 | 139.9 | 181.4 | 178.2 | 183.8 | 162.5 | 159.1 | 164.9 | 149.8 | 146.5 |
| 2004 | 118.1 | 127.9 | 127.0 | 120.1 | NA | 118.0 | 134.0 | 132.6 | 119.4 | 113.7 | 108.8 | 120.7 |
| 2005 | 115.6 | 118.8 | 108.7 | 99.4 | 110.3 | 120.5 | 119.4 | 111.7 | 99.0 | 102.6 | 113.9 | 120.5 |
| 2006 | 108.6 | 117.5 | 112.9 | 105.0 | 98.5 | 112.2 | 116.1 | 117.8 | 123.7 | 125.2 | 113.1 | 117.1 |
| 2007 | 105.6 | 117.5 | 111.4 | 102.5 | 103.4 | 115.2 | 124.3 | 129.6 | 120.4 | 113.7 | 102.1 | 99.7 |
| 2008 | 95.5 | 99.5 | 92.6 | 91.9 | 89.4 | 86.4 | 92.1 | 96.3 | 96.9 | 95.5 | 103.9 | 99.0 |
| 2009 | 97.5 | 79.0 | 81.5 | 81.3 | 81.9 | 79.3 | 86.2 | 80.1 | 74.3 | 74.1 | 57.9 | 61.8 |
| 2010 | 31.7 | 44.9 | 37.6 | 37.5 | 37.4 | 38.8 | 40.0 | 39.5 | 39.5 | 38.0 | 35.3 | 36.1 |
| 2011 | 34.5 | 35.4 | 33.4 | 34.5 | 33.3 | 34.9 | 34.6 | 32.7 | 31.7 | 31.4 | 31.1 | 33.7 |
| 2012 | 30.9 | 36.4 | 34.6 | 36.3 | 37.1 | 37.3 | 40.2 | 39.4 | 37.6 | 36.9 | 39.4 | 39.0 |
| 2013 | 36.5 | 37.9 | 39.7 | 40.3 | 39.7 | 41.3 | 41.9 | 43.7 | 36.0 | 35.9 | 31.5 | 32.8 |
| 2014 | 38.4 | 39.9 | 41.6 | 41.8 | 42.2 | 44.1 | 45.3 | 46.1 | 46.4 | 38.3 | 44.0 | 42.3 |
| 2015 | 43.7 | 44.8 | 44.4 | 47.6 | 48.8 | 50.1 | 49.7 | 49.0 | 46.8 | 43.6 | 43.7 | 42.2 |
| 2016 | 40.3 | 45.6 | 44.7 | 47.7 | 46.0 | 48.3 | 47.3 | 49.2 | 46.1 | 41.3 | 41.4 | 43.6 |
| 2017 | 41.5 | 43.2 | 44.9 | 45.4 | 48.7 | 51.0 | 52.4 | 52.5 | 45.6 | 50.1 | 46.5 | 47.4 |
| 2018 | 45.6 | 46.3 | 46.8 | 39.9 | 46.5 | 46.0 | 44.8 | 46.5 | 45.9 | 44.1 | 42.9 | 44.4 |
| 2019 | 43.5 | 42.7 | 48.1 | 44.7 | 47.8 | 48.8 | 50.0 | 50.8 | 48.2 | 47.1 | 45.3 | 44.6 |
| 2020 | 44.0 | 47.4 | 37.6 | 29.8 | 36.4 | 40.9 | 43.6 | 43.8 | 41.6 | 41.8 | 37.8 | 38.4 |
| 2021 | 35.9 | 31.9 | 39.5 | 41.9 | 35.1 | 32.3 | 33.3 | NA | NA | NA | 28.3 | 27.5 |
| 2022 | NA | 29.0 | 26.9 | |||||||||
| - = No Data Reported; -- = Not Applicable; NA = Not Available; W = Withheld to avoid disclosure of individual company data. |
| Release Date: 6/1/2022 |
| Next Release Date: TBD |