|
Download Data (XLS File) |
|
||||||||
|
||||||||
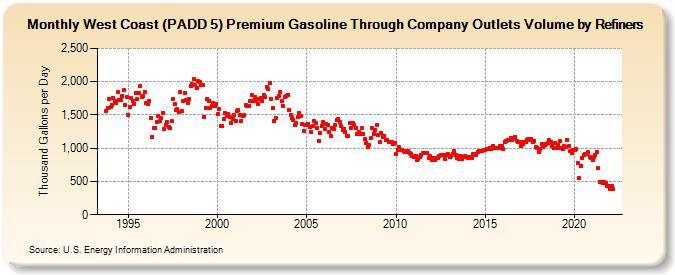
| West Coast (PADD 5) Premium Gasoline Through Company Outlets Volume by Refiners (Thousand Gallons per Day) | ||||||||
| Year | Jan | Feb | Mar | Apr | May | Jun | Jul | Aug | Sep | Oct | Nov | Dec |
|---|---|---|---|---|---|---|---|---|---|---|---|---|
| 1993 | 1,554.2 | 1,601.6 | 1,734.0 | |||||||||
| 1994 | 1,617.3 | 1,651.4 | 1,756.4 | 1,712.2 | 1,672.0 | 1,838.7 | 1,725.0 | 1,726.3 | 1,789.1 | 1,876.2 | 1,648.5 | 1,771.8 |
| 1995 | 1,500.5 | 1,625.1 | 1,753.5 | 1,710.3 | 1,668.3 | 1,830.1 | 1,733.4 | 1,825.6 | 1,936.0 | 1,770.1 | 1,787.8 | 1,851.3 |
| 1996 | 1,675.2 | 1,662.5 | 1,702.0 | 1,456.9 | 1,170.2 | 1,301.6 | 1,307.0 | 1,386.8 | 1,490.5 | 1,411.3 | 1,448.6 | 1,529.4 |
| 1997 | 1,289.9 | 1,352.9 | 1,393.8 | 1,321.3 | 1,298.1 | 1,402.3 | 1,736.7 | 1,667.3 | 1,576.9 | 1,584.1 | 1,545.8 | 1,845.6 |
| 1998 | 1,552.8 | 1,710.2 | 1,831.5 | 1,722.8 | 1,675.6 | 1,732.6 | 1,931.7 | 1,963.7 | 2,035.8 | 1,947.3 | 1,900.9 | 2,003.0 |
| 1999 | 1,993.3 | 1,950.4 | 1,942.8 | 1,473.4 | 1,610.3 | 1,742.3 | 1,713.0 | 1,610.3 | 1,630.3 | 1,685.6 | 1,637.1 | 1,663.6 |
| 2000 | 1,510.2 | 1,581.9 | 1,337.1 | 1,336.7 | 1,446.0 | 1,525.8 | 1,487.9 | 1,516.4 | 1,468.6 | 1,374.6 | 1,432.0 | 1,492.6 |
| 2001 | 1,412.5 | 1,556.8 | 1,568.9 | 1,497.8 | 1,405.5 | 1,490.8 | 1,494.4 | 1,652.6 | 1,639.8 | 1,634.6 | 1,710.8 | 1,801.2 |
| 2002 | 1,710.4 | 1,770.3 | 1,711.8 | 1,670.3 | 1,744.0 | 1,751.1 | 1,714.4 | 1,799.3 | 1,776.6 | 1,921.2 | 1,891.2 | 1,972.7 |
| 2003 | 1,744.5 | 1,600.8 | 1,404.9 | 1,458.4 | 1,756.2 | 1,778.5 | 1,843.0 | 1,716.7 | 1,633.7 | 1,768.6 | 1,781.9 | 1,804.5 |
| 2004 | 1,570.0 | 1,502.0 | 1,450.6 | 1,427.9 | 1,344.3 | 1,378.6 | 1,473.5 | 1,521.5 | 1,482.1 | 1,361.2 | 1,253.2 | 1,348.1 |
| 2005 | 1,343.6 | 1,368.2 | 1,320.8 | 1,247.1 | 1,331.5 | 1,404.7 | 1,378.4 | 1,302.6 | 1,105.5 | 1,234.5 | 1,337.1 | 1,396.1 |
| 2006 | 1,291.1 | 1,367.3 | 1,353.6 | 1,247.9 | 1,179.4 | 1,298.2 | 1,286.7 | 1,345.1 | 1,423.4 | 1,442.5 | 1,390.2 | 1,331.3 |
| 2007 | 1,280.3 | 1,292.9 | 1,247.9 | 1,186.8 | 1,188.2 | 1,381.2 | 1,300.7 | 1,376.3 | 1,353.3 | 1,300.1 | 1,214.9 | 1,242.4 |
| 2008 | 1,218.8 | 1,298.8 | 1,211.6 | 1,136.3 | 1,072.4 | 1,021.8 | 1,052.1 | 1,146.3 | 1,306.7 | 1,209.7 | 1,271.8 | 1,348.5 |
| 2009 | 1,196.7 | 1,087.1 | 1,226.3 | 1,165.1 | 1,187.6 | 1,116.6 | 1,128.5 | 1,100.2 | 1,091.5 | 1,091.5 | 1,065.1 | 1,077.4 |
| 2010 | 917.2 | 970.4 | 1,014.3 | 970.6 | 975.8 | 962.8 | 936.7 | 945.4 | 962.0 | 922.3 | 909.2 | 880.8 |
| 2011 | 861.4 | 883.4 | 825.4 | 839.4 | 861.1 | 902.7 | 929.7 | 933.0 | 923.6 | 929.7 | 847.5 | 878.0 |
| 2012 | 829.0 | 847.9 | 823.2 | 848.1 | 854.4 | 876.5 | 900.5 | 895.5 | 890.4 | 843.6 | 901.3 | 916.5 |
| 2013 | 873.2 | 875.3 | 916.9 | 951.3 | 892.0 | 850.1 | 837.4 | 889.6 | 830.2 | 862.8 | 877.5 | 868.8 |
| 2014 | 856.3 | 863.8 | 866.0 | 856.5 | 913.6 | 908.8 | 896.1 | 943.2 | 955.5 | 955.7 | 951.7 | 978.6 |
| 2015 | 978.4 | 994.1 | 990.4 | 1,003.3 | 988.1 | 1,037.5 | 1,002.2 | 1,005.4 | 997.6 | 996.7 | 1,031.9 | 1,035.5 |
| 2016 | 986.4 | 1,097.7 | 1,104.3 | 1,122.3 | 1,126.4 | 1,153.0 | 1,120.4 | 1,154.3 | 1,169.8 | 1,111.2 | 1,091.4 | 1,098.2 |
| 2017 | 1,033.5 | 1,059.0 | 1,099.1 | 1,092.0 | 1,128.5 | 1,136.8 | 1,129.2 | 1,130.8 | 1,093.0 | 1,112.5 | 1,023.8 | 1,006.5 |
| 2018 | 949.2 | 986.2 | 1,059.1 | 1,012.5 | 1,055.2 | 1,065.6 | 1,074.6 | 1,115.9 | 1,085.6 | 1,031.1 | 1,004.9 | 1,074.8 |
| 2019 | 997.3 | 1,051.8 | 1,104.3 | 1,010.2 | 986.5 | 1,032.0 | 1,019.4 | 1,126.9 | 1,031.9 | 955.2 | 932.9 | 967.7 |
| 2020 | 975.3 | 984.0 | 776.7 | 546.2 | 730.2 | 853.7 | 890.4 | 909.6 | 917.1 | 938.4 | 866.4 | 856.8 |
| 2021 | 814.9 | 860.0 | 903.7 | 943.6 | 696.5 | 498.9 | 495.2 | 481.8 | 491.7 | 476.1 | 432.1 | 425.0 |
| 2022 | 389.4 | 426.8 | 383.5 | |||||||||
| - = No Data Reported; -- = Not Applicable; NA = Not Available; W = Withheld to avoid disclosure of individual company data. |
| Release Date: 6/1/2022 |
| Next Release Date: TBD |