|
Download Data (XLS File) |
|
||||||||
|
||||||||
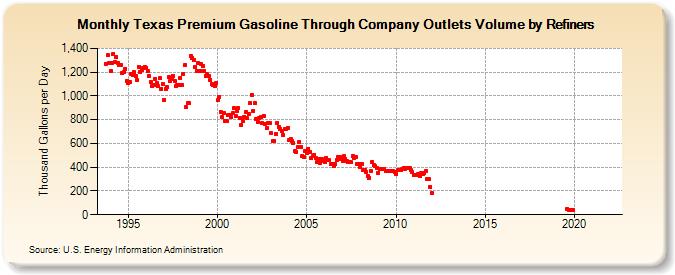
| Texas Premium Gasoline Through Company Outlets Volume by Refiners (Thousand Gallons per Day) | ||||||||
| Year | Jan | Feb | Mar | Apr | May | Jun | Jul | Aug | Sep | Oct | Nov | Dec |
|---|---|---|---|---|---|---|---|---|---|---|---|---|
| 1993 | 1,271.5 | 1,340.4 | 1,281.0 | |||||||||
| 1994 | 1,207.1 | 1,280.0 | 1,356.6 | 1,287.4 | 1,329.6 | 1,279.9 | 1,256.5 | 1,263.4 | 1,189.7 | 1,201.5 | 1,227.2 | 1,128.3 |
| 1995 | 1,112.0 | 1,117.5 | 1,186.2 | 1,176.9 | 1,198.4 | 1,164.6 | 1,130.7 | 1,245.8 | 1,203.6 | 1,219.9 | 1,236.2 | 1,244.8 |
| 1996 | 1,239.0 | 1,209.6 | 1,170.3 | 1,119.5 | 1,079.7 | 1,089.7 | 1,146.3 | 1,107.9 | 1,081.2 | 1,147.8 | 1,061.3 | 1,103.6 |
| 1997 | 968.0 | 1,058.2 | 1,070.9 | 1,157.6 | 1,121.6 | 1,141.1 | 1,169.5 | 1,126.5 | 1,080.6 | 1,093.5 | 1,088.4 | 1,149.6 |
| 1998 | 1,091.9 | 1,187.2 | 1,258.6 | 906.4 | 936.6 | 939.6 | 1,336.3 | 1,323.1 | 1,300.6 | 1,245.9 | 1,212.6 | 1,276.6 |
| 1999 | 1,212.9 | 1,265.9 | 1,252.5 | 1,210.8 | 1,168.3 | 1,183.1 | 1,164.9 | 1,136.5 | 1,099.6 | 1,091.8 | 1,082.8 | 1,112.7 |
| 2000 | 962.6 | 993.3 | 868.1 | 819.5 | 856.1 | 790.3 | 789.3 | 836.5 | 840.1 | 825.5 | 852.5 | 900.2 |
| 2001 | 826.9 | 876.4 | 894.1 | 813.4 | 755.1 | 786.9 | 825.1 | 864.6 | 811.8 | 844.5 | 939.9 | 1,008.6 |
| 2002 | 876.5 | 940.2 | 807.5 | 779.7 | 810.9 | 823.8 | 772.0 | 833.4 | 766.3 | 729.6 | 768.8 | 769.5 |
| 2003 | 686.8 | 617.4 | 623.7 | 681.7 | 772.8 | 742.3 | 722.9 | 701.9 | 670.4 | 719.6 | 721.9 | 733.9 |
| 2004 | 625.1 | 640.2 | 618.8 | 600.4 | 534.5 | 529.5 | 568.3 | 615.2 | 572.8 | 497.6 | 486.2 | 538.7 |
| 2005 | 518.4 | 555.3 | 531.9 | 473.9 | 491.1 | 502.4 | 473.2 | 445.7 | 464.9 | 434.3 | 466.1 | 449.9 |
| 2006 | 440.6 | 479.5 | 461.2 | 456.7 | 424.1 | 429.9 | 413.6 | 431.0 | 464.2 | 484.9 | 487.8 | 466.9 |
| 2007 | 452.9 | 491.7 | 469.4 | 448.6 | 445.8 | 443.0 | 440.3 | 492.9 | 478.8 | 482.0 | 422.7 | 428.0 |
| 2008 | 399.9 | 428.6 | 377.5 | 376.4 | 360.5 | 329.4 | 312.9 | 364.6 | 442.2 | 416.9 | 407.3 | 396.1 |
| 2009 | 353.5 | 382.0 | 386.2 | 384.7 | 380.6 | 366.6 | 371.1 | 369.9 | 371.0 | 371.5 | 364.6 | 362.5 |
| 2010 | 341.0 | 375.1 | 372.8 | 376.2 | 382.9 | 395.3 | 385.1 | 392.6 | 391.6 | 390.4 | 372.8 | 356.0 |
| 2011 | 331.2 | 336.9 | 338.1 | 339.6 | 328.0 | 353.1 | 346.1 | 354.4 | 366.0 | 301.9 | 297.5 | 234.6 |
| 2012 | 183.1 | W | W | W | W | W | W | W | W | W | W | W |
| 2013 | W | W | W | W | W | W | W | W | W | W | W | W |
| 2014 | W | W | W | W | W | NA | W | W | W | W | NA | W |
| 2015 | W | W | W | W | W | W | W | W | W | W | W | W |
| 2016 | NA | NA | W | W | W | W | W | W | W | W | W | W |
| 2017 | W | W | W | W | W | W | W | W | W | W | W | W |
| 2018 | W | W | W | W | W | W | W | W | W | W | W | W |
| 2019 | W | W | W | W | W | W | W | 50.4 | 42.2 | 43.8 | 42.8 | 38.7 |
| 2020 | W | W | W | W | W | W | W | W | W | W | W | W |
| 2021 | W | W | W | W | W | W | W | W | W | W | W | W |
| 2022 | W | W | W | |||||||||
| - = No Data Reported; -- = Not Applicable; NA = Not Available; W = Withheld to avoid disclosure of individual company data. |
| Release Date: 6/1/2022 |
| Next Release Date: TBD |