|
Download Data (XLS File) |
|
||||||||
|
||||||||
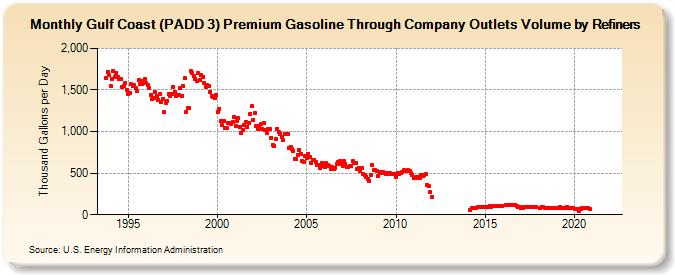
| Gulf Coast (PADD 3) Premium Gasoline Through Company Outlets Volume by Refiners (Thousand Gallons per Day) | ||||||||
| Year | Jan | Feb | Mar | Apr | May | Jun | Jul | Aug | Sep | Oct | Nov | Dec |
|---|---|---|---|---|---|---|---|---|---|---|---|---|
| 1993 | 1,641.0 | 1,721.1 | 1,674.2 | |||||||||
| 1994 | 1,548.5 | 1,637.3 | 1,730.0 | 1,659.5 | 1,706.5 | 1,651.2 | 1,628.6 | 1,633.1 | 1,532.2 | 1,545.3 | 1,581.9 | 1,495.2 |
| 1995 | 1,449.4 | 1,467.9 | 1,566.0 | 1,553.7 | 1,557.6 | 1,518.0 | 1,488.8 | 1,614.8 | 1,569.1 | 1,575.6 | 1,604.7 | 1,627.5 |
| 1996 | 1,578.8 | 1,561.6 | 1,521.2 | 1,436.4 | 1,389.2 | 1,401.1 | 1,474.6 | 1,427.7 | 1,380.0 | 1,455.0 | 1,349.7 | 1,394.1 |
| 1997 | 1,232.0 | 1,337.4 | 1,364.7 | 1,452.1 | 1,426.9 | 1,452.7 | 1,539.2 | 1,478.9 | 1,425.3 | 1,443.9 | 1,437.9 | 1,521.4 |
| 1998 | 1,427.3 | 1,545.1 | 1,640.0 | 1,233.5 | 1,284.6 | 1,282.7 | 1,732.7 | 1,702.3 | 1,672.5 | 1,630.7 | 1,609.2 | 1,706.1 |
| 1999 | 1,619.5 | 1,681.3 | 1,655.1 | 1,577.9 | 1,538.0 | 1,556.9 | 1,544.7 | 1,478.9 | 1,426.1 | 1,416.9 | 1,403.3 | 1,445.0 |
| 2000 | 1,239.1 | 1,273.5 | 1,124.5 | 1,078.5 | 1,129.1 | 1,043.8 | 1,044.7 | 1,102.8 | 1,101.3 | 1,090.2 | 1,116.3 | 1,172.6 |
| 2001 | 1,064.2 | 1,131.1 | 1,159.0 | 1,059.9 | 985.4 | 1,015.7 | 1,078.7 | 1,119.2 | 1,054.1 | 1,101.9 | 1,216.8 | 1,305.0 |
| 2002 | 1,134.4 | 1,225.9 | 1,070.9 | 1,031.8 | 1,072.1 | 1,085.7 | 1,031.7 | 1,102.1 | 1,023.1 | 986.0 | 1,034.9 | 1,032.5 |
| 2003 | 923.6 | 836.0 | 826.4 | 910.2 | 1,036.7 | 989.7 | 971.8 | 935.6 | 897.9 | 974.3 | 976.1 | 965.1 |
| 2004 | 797.3 | 818.1 | 788.9 | 761.3 | 675.0 | 664.7 | 723.8 | 779.7 | 734.9 | 643.8 | 639.6 | 711.7 |
| 2005 | 680.4 | 731.8 | 690.8 | 623.9 | 652.0 | 663.7 | 634.1 | 597.1 | 592.8 | 558.5 | 617.5 | 586.8 |
| 2006 | 569.5 | 621.5 | 599.0 | 587.2 | 554.9 | 569.0 | 545.3 | 562.5 | 610.3 | 638.4 | 642.3 | 608.4 |
| 2007 | 589.5 | 640.3 | 612.3 | 579.5 | 573.1 | 580.8 | 583.7 | 643.7 | 622.6 | 627.5 | 551.6 | 559.8 |
| 2008 | 522.9 | 556.3 | 484.2 | 478.3 | 459.5 | 424.4 | 408.1 | 478.9 | 593.6 | 535.1 | 535.1 | 530.1 |
| 2009 | 470.6 | 504.2 | 511.4 | 511.0 | 502.9 | 487.3 | 498.9 | 495.5 | 497.9 | 495.3 | 486.6 | 486.5 |
| 2010 | 449.9 | 496.1 | 494.6 | 501.8 | 516.7 | 533.1 | 522.7 | 525.7 | 531.9 | 524.4 | 499.4 | 477.7 |
| 2011 | 440.4 | 449.0 | 447.2 | 449.2 | 438.3 | 472.4 | 464.6 | 475.2 | 486.0 | 359.9 | 343.3 | 269.7 |
| 2012 | 214.9 | W | W | W | W | W | W | W | W | W | W | W |
| 2013 | W | W | W | W | W | W | W | W | W | W | W | W |
| 2014 | W | W | 59.1 | 79.3 | 83.2 | NA | 86.0 | 89.7 | 89.4 | 93.0 | NA | 97.9 |
| 2015 | 97.2 | 96.5 | 98.5 | 102.4 | 98.6 | 99.5 | 101.8 | 102.8 | 108.0 | 105.4 | 104.2 | 109.1 |
| 2016 | NA | NA | 114.3 | 115.2 | 115.1 | 114.3 | 119.1 | 116.8 | 118.4 | 109.6 | 96.8 | 87.8 |
| 2017 | 80.2 | 85.7 | 93.1 | W | 92.3 | 96.6 | 95.4 | 96.4 | 91.6 | 91.4 | 87.5 | W |
| 2018 | W | 83.4 | 91.1 | 87.9 | 85.4 | 81.1 | 83.7 | 86.7 | 84.2 | 80.5 | 82.4 | 83.6 |
| 2019 | 79.4 | 85.6 | 88.8 | 84.0 | 82.5 | 83.9 | 85.2 | 95.5 | 84.1 | 82.5 | 79.1 | 75.7 |
| 2020 | 69.1 | 73.6 | 65.8 | 50.3 | 66.9 | 76.7 | 77.3 | 80.7 | 81.2 | 79.1 | 69.8 | W |
| 2021 | W | W | W | W | W | W | W | W | W | W | W | W |
| 2022 | W | W | W | |||||||||
| - = No Data Reported; -- = Not Applicable; NA = Not Available; W = Withheld to avoid disclosure of individual company data. |
| Release Date: 6/1/2022 |
| Next Release Date: TBD |