|
Download Data (XLS File) |
|
||||||||
|
||||||||
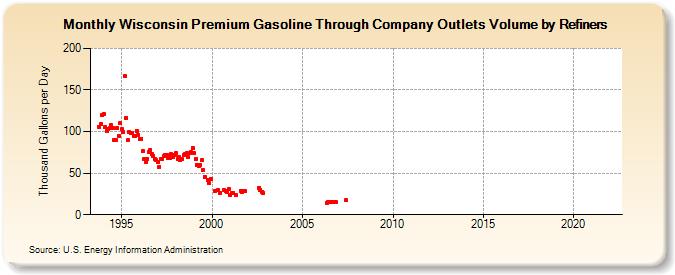
| Wisconsin Premium Gasoline Through Company Outlets Volume by Refiners (Thousand Gallons per Day) | ||||||||
| Year | Jan | Feb | Mar | Apr | May | Jun | Jul | Aug | Sep | Oct | Nov | Dec |
|---|---|---|---|---|---|---|---|---|---|---|---|---|
| 1993 | 105.7 | 108.7 | 119.5 | |||||||||
| 1994 | 121.3 | 105.4 | 101.1 | 102.8 | 104.1 | 107.3 | 103.7 | 89.4 | 89.5 | 104.1 | 95.0 | 110.5 |
| 1995 | 102.7 | 99.5 | 166.8 | 116.7 | 89.4 | 99.7 | 98.5 | 98.0 | 94.5 | 94.2 | 100.9 | 96.1 |
| 1996 | 91.2 | 91.2 | 76.3 | 66.7 | 63.5 | 67.1 | 75.3 | 78.2 | 72.9 | 71.2 | 66.6 | 65.6 |
| 1997 | 62.9 | 57.8 | 66.7 | 67.0 | 70.2 | 71.4 | 72.0 | 67.6 | 68.5 | 73.0 | 69.1 | 72.4 |
| 1998 | 73.8 | 67.2 | 69.3 | 66.0 | 66.5 | 71.7 | 73.2 | 74.2 | 69.2 | 74.5 | 75.0 | 80.5 |
| 1999 | 73.7 | 67.1 | 60.1 | 59.1 | 60.3 | 65.2 | 53.5 | 45.9 | W | 42.0 | 38.1 | 43.3 |
| 2000 | W | W | 28.7 | W | 29.3 | 26.7 | W | W | 29.5 | 28.7 | 27.4 | 30.8 |
| 2001 | 24.3 | 25.9 | 26.4 | NA | 23.3 | W | W | 29.0 | 27.1 | 28.4 | 28.5 | W |
| 2002 | W | W | W | W | W | W | W | 32.6 | 30.0 | 27.4 | 26.4 | W |
| 2003 | W | W | W | W | W | W | W | W | W | W | W | W |
| 2004 | W | W | W | W | W | W | W | W | W | W | W | W |
| 2005 | W | W | W | W | W | W | W | W | W | W | W | W |
| 2006 | W | W | W | W | 14.2 | 15.4 | W | 15.1 | 15.7 | 15.7 | 14.9 | W |
| 2007 | W | W | W | W | W | 17.2 | W | W | W | W | W | W |
| 2008 | W | W | W | W | W | W | W | W | W | W | W | W |
| 2009 | W | W | W | W | W | W | W | W | W | W | W | W |
| 2010 | W | W | W | W | W | W | W | W | W | W | W | W |
| 2011 | W | W | W | W | W | W | W | W | W | W | W | W |
| 2012 | W | W | W | W | W | W | W | W | W | W | W | W |
| 2013 | W | W | W | W | W | W | W | W | W | W | W | W |
| 2014 | W | W | W | W | W | W | W | W | W | W | W | W |
| 2015 | W | W | W | W | W | W | W | W | W | W | W | W |
| 2016 | W | W | W | W | W | W | W | W | W | W | W | W |
| 2017 | W | W | W | W | W | W | W | W | W | W | W | W |
| 2018 | W | W | W | W | W | W | W | W | W | W | W | W |
| 2019 | W | W | W | W | W | W | W | W | W | W | W | W |
| 2020 | W | W | W | W | W | W | W | W | W | W | W | W |
| 2021 | W | W | W | W | W | - | - | - | - | - | - | - |
| 2022 | - | - | - | |||||||||
| - = No Data Reported; -- = Not Applicable; NA = Not Available; W = Withheld to avoid disclosure of individual company data. |
| Release Date: 6/1/2022 |
| Next Release Date: TBD |