|
Download Data (XLS File) |
|
||||||||
|
||||||||
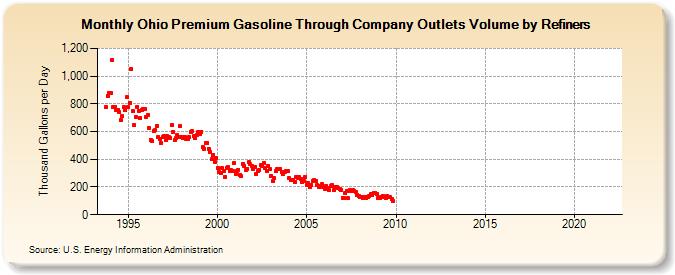
| Ohio Premium Gasoline Through Company Outlets Volume by Refiners (Thousand Gallons per Day) | ||||||||
| Year | Jan | Feb | Mar | Apr | May | Jun | Jul | Aug | Sep | Oct | Nov | Dec |
|---|---|---|---|---|---|---|---|---|---|---|---|---|
| 1993 | 775.5 | 856.5 | 878.5 | |||||||||
| 1994 | 876.4 | 1,115.4 | 776.8 | 777.7 | 755.8 | 756.8 | 738.8 | 682.4 | 711.6 | 775.9 | 752.2 | 846.3 |
| 1995 | 775.0 | 809.3 | 1,052.6 | 745.6 | 645.1 | 707.2 | 780.1 | 751.7 | 697.7 | 755.1 | 759.3 | 763.1 |
| 1996 | 705.9 | 718.6 | 628.2 | 541.7 | 528.3 | 606.0 | 610.6 | 640.3 | 560.5 | 549.0 | 517.0 | 560.0 |
| 1997 | 568.4 | 541.9 | 566.3 | 563.3 | 554.2 | 646.2 | 597.8 | 536.6 | 552.0 | 572.5 | 562.3 | 637.0 |
| 1998 | 562.7 | 556.7 | 558.9 | 544.2 | 543.5 | 559.3 | 598.5 | 602.4 | 565.7 | 550.0 | 572.3 | 597.9 |
| 1999 | 582.9 | 600.0 | 487.6 | 477.5 | 520.6 | 519.8 | 477.1 | 452.3 | 399.8 | 432.0 | 383.4 | 411.4 |
| 2000 | 338.7 | 306.2 | 299.5 | 338.7 | 317.1 | 274.7 | 339.2 | 343.4 | 317.6 | 319.8 | 318.6 | 373.7 |
| 2001 | 292.3 | 318.0 | 326.2 | 287.6 | 277.0 | 367.4 | 352.0 | 323.1 | 332.5 | 378.5 | 362.7 | 353.7 |
| 2002 | 331.5 | 346.5 | 297.1 | 312.6 | 324.9 | 355.1 | 355.0 | 373.4 | 334.9 | 313.5 | 349.5 | 328.7 |
| 2003 | 282.7 | 242.9 | 263.5 | 312.6 | 328.9 | 331.5 | 332.0 | 306.8 | 296.4 | 306.6 | 314.4 | 314.8 |
| 2004 | 262.1 | 250.8 | 248.6 | 247.2 | 236.4 | 271.4 | 267.7 | 272.0 | 260.7 | 234.5 | 241.8 | 272.9 |
| 2005 | 216.8 | 225.5 | 199.5 | 214.5 | 246.8 | 248.5 | 245.4 | 215.5 | 200.0 | 206.2 | 218.5 | 202.4 |
| 2006 | 184.1 | 206.1 | 193.2 | 180.0 | 204.9 | 214.5 | 180.0 | 201.8 | 202.8 | 190.2 | 182.5 | 177.1 |
| 2007 | 122.7 | 123.0 | 156.5 | 172.8 | 118.1 | 176.5 | 173.0 | 176.8 | 169.3 | 164.3 | 142.1 | 134.7 |
| 2008 | 127.9 | 129.0 | 119.0 | 131.1 | 122.1 | 128.7 | 138.5 | 146.9 | 139.5 | 155.9 | 157.2 | 150.6 |
| 2009 | 123.6 | 124.0 | 126.6 | 136.0 | 128.9 | 119.5 | 135.1 | 130.6 | 125.8 | 110.2 | 101.7 | W |
| 2010 | W | W | W | W | W | W | W | W | W | W | W | W |
| 2011 | W | W | W | W | W | W | W | W | W | W | W | W |
| 2012 | W | W | W | W | W | W | W | W | W | W | W | W |
| 2013 | W | W | W | W | W | W | W | W | W | W | W | W |
| 2014 | W | W | W | W | W | W | W | W | W | W | W | W |
| 2015 | W | W | W | W | W | W | W | W | W | W | W | W |
| 2016 | W | W | W | W | W | W | W | W | W | W | W | W |
| 2017 | W | W | W | W | W | W | W | W | W | W | W | W |
| 2018 | W | W | W | W | W | W | W | W | W | W | W | W |
| 2019 | W | W | W | W | W | W | W | W | W | W | W | W |
| 2020 | W | W | W | W | W | W | W | W | W | W | W | W |
| 2021 | W | W | W | W | W | W | W | W | W | W | W | W |
| 2022 | W | W | W | |||||||||
| - = No Data Reported; -- = Not Applicable; NA = Not Available; W = Withheld to avoid disclosure of individual company data. |
| Release Date: 6/1/2022 |
| Next Release Date: TBD |