|
Download Data (XLS File) |
|
||||||||
|
||||||||
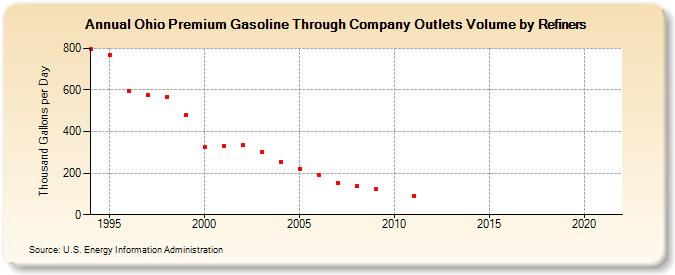
| Ohio Premium Gasoline Through Company Outlets Volume by Refiners (Thousand Gallons per Day) | ||||||||
| Decade | Year-0 | Year-1 | Year-2 | Year-3 | Year-4 | Year-5 | Year-6 | Year-7 | Year-8 | Year-9 |
|---|---|---|---|---|---|---|---|---|---|---|
| 1990's | 795.1 | 770.3 | 597.0 | 575.1 | 567.9 | 478.1 | ||||
| 2000's | 324.2 | 330.9 | 335.1 | 303.1 | 255.5 | 219.9 | 193.0 | 152.6 | 137.2 | 121.3 |
| 2010's | W | 89.8 | W | W | W | W | W | W | W | W |
| 2020's | W |
| - = No Data Reported; -- = Not Applicable; NA = Not Available; W = Withheld to avoid disclosure of individual company data. |
| Release Date: 6/1/2022 |
| Next Release Date: TBD |