|
Download Data (XLS File) |
|
||||||||
|
||||||||
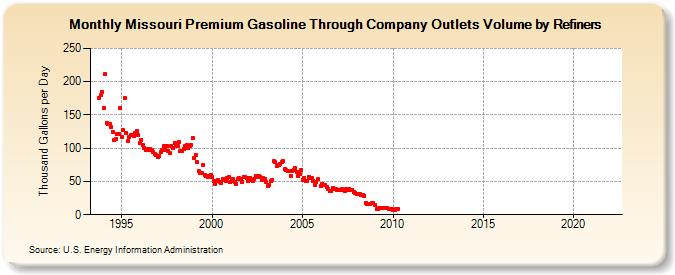
| Missouri Premium Gasoline Through Company Outlets Volume by Refiners (Thousand Gallons per Day) | ||||||||
| Year | Jan | Feb | Mar | Apr | May | Jun | Jul | Aug | Sep | Oct | Nov | Dec |
|---|---|---|---|---|---|---|---|---|---|---|---|---|
| 1993 | 175.4 | 179.4 | 185.2 | |||||||||
| 1994 | 160.3 | 211.1 | 138.6 | 136.4 | 135.8 | 131.8 | 124.6 | 111.9 | 113.8 | 120.6 | 120.6 | 159.9 |
| 1995 | 117.1 | 127.1 | 175.5 | 123.0 | 111.1 | 116.8 | 119.5 | 120.2 | 117.9 | 123.1 | 125.9 | 120.2 |
| 1996 | 108.1 | 112.3 | 105.5 | 100.2 | 97.0 | 98.9 | 97.3 | 98.6 | 96.8 | 93.6 | 91.0 | 89.2 |
| 1997 | 86.1 | 88.5 | 94.0 | 96.8 | 103.5 | 97.0 | 103.8 | 95.5 | 92.9 | 103.6 | 100.2 | 107.5 |
| 1998 | 103.8 | 102.6 | 109.0 | 95.6 | 96.2 | 99.5 | 102.7 | 104.3 | 100.0 | 103.6 | 105.0 | 115.4 |
| 1999 | 85.9 | 90.5 | 78.6 | 65.2 | 62.9 | 62.6 | 74.9 | 59.5 | 58.2 | 56.5 | 58.1 | 60.0 |
| 2000 | 56.9 | 51.2 | 46.7 | 51.3 | 51.9 | 49.4 | 48.3 | 54.4 | 51.6 | 50.3 | 55.4 | 56.5 |
| 2001 | 49.7 | 50.0 | 53.5 | 49.2 | 46.7 | 53.6 | 54.7 | 53.8 | 48.8 | 57.2 | 56.7 | 55.9 |
| 2002 | 50.3 | 55.9 | 51.9 | 51.2 | 54.4 | 57.5 | 56.7 | 58.0 | 57.3 | 52.2 | 55.3 | 54.1 |
| 2003 | 49.4 | 42.8 | 44.5 | 50.1 | 52.6 | 80.0 | 78.7 | 73.4 | 74.9 | 76.1 | 78.8 | 80.3 |
| 2004 | 68.0 | 66.6 | 65.7 | 66.4 | 58.9 | 65.4 | 67.6 | 69.8 | 63.9 | 57.7 | 61.1 | 67.3 |
| 2005 | 52.8 | 55.6 | 51.2 | 51.1 | 57.1 | 55.4 | 55.8 | 50.4 | 45.3 | 48.7 | 53.1 | NA |
| 2006 | 42.6 | 46.2 | 44.1 | 45.4 | 41.2 | 38.2 | 35.2 | 36.0 | 40.9 | 39.1 | 38.1 | 37.0 |
| 2007 | 37.1 | 37.6 | 38.3 | 37.8 | 35.3 | 39.0 | 36.4 | 38.7 | 37.5 | 37.5 | 33.6 | 32.2 |
| 2008 | 31.5 | 30.4 | 30.8 | 30.1 | 29.0 | 28.8 | 18.2 | 16.5 | 16.0 | 16.6 | 17.8 | 16.9 |
| 2009 | 14.3 | 8.2 | 8.7 | 9.5 | 9.6 | 9.8 | 10.8 | 10.2 | 10.4 | 9.0 | 9.2 | 8.9 |
| 2010 | 7.0 | 7.4 | 8.2 | 9.1 | W | W | W | W | W | W | W | W |
| 2011 | W | W | W | W | W | W | W | W | W | - | - | - |
| 2012 | - | - | - | - | - | - | - | - | - | - | - | - |
| 2013 | - | - | - | - | - | - | - | - | - | - | - | - |
| 2014 | - | - | - | - | - | - | - | - | - | - | - | - |
| 2015 | - | - | - | - | - | - | - | - | - | - | - | - |
| 2016 | - | - | - | - | - | - | - | - | - | - | - | - |
| 2017 | - | - | - | - | - | - | - | - | - | - | - | - |
| 2018 | - | - | - | - | - | - | - | - | - | - | - | - |
| 2019 | - | - | - | - | - | - | - | - | - | - | - | - |
| 2020 | - | - | - | - | - | - | - | - | - | - | - | - |
| 2021 | - | - | - | - | - | - | - | - | - | - | - | - |
| 2022 | - | - | - | |||||||||
| - = No Data Reported; -- = Not Applicable; NA = Not Available; W = Withheld to avoid disclosure of individual company data. |
| Release Date: 6/1/2022 |
| Next Release Date: TBD |