|
Download Data (XLS File) |
|
||||||||
|
||||||||
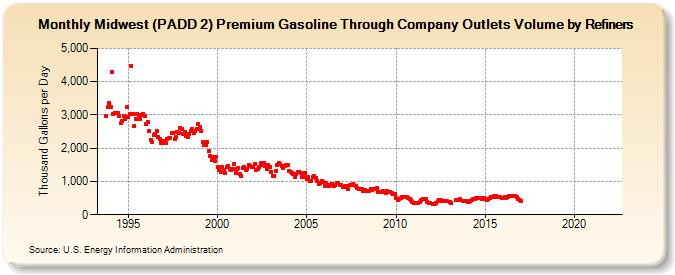
| Midwest (PADD 2) Premium Gasoline Through Company Outlets Volume by Refiners (Thousand Gallons per Day) | ||||||||
| Year | Jan | Feb | Mar | Apr | May | Jun | Jul | Aug | Sep | Oct | Nov | Dec |
|---|---|---|---|---|---|---|---|---|---|---|---|---|
| 1993 | 2,955.5 | 3,232.7 | 3,354.8 | |||||||||
| 1994 | 3,242.1 | 4,303.3 | 3,028.9 | 3,058.5 | 3,046.7 | 3,065.5 | 2,968.1 | 2,745.3 | 2,829.2 | 2,973.0 | 2,885.8 | 3,244.7 |
| 1995 | 2,925.2 | 3,013.9 | 4,470.2 | 3,038.3 | 2,665.3 | 2,887.0 | 3,027.4 | 3,008.3 | 2,866.0 | 2,995.5 | 3,034.2 | 2,955.8 |
| 1996 | 2,720.4 | 2,789.0 | 2,514.4 | 2,253.8 | 2,185.8 | 2,384.3 | 2,415.7 | 2,520.6 | 2,331.4 | 2,273.5 | 2,144.2 | 2,207.3 |
| 1997 | 2,162.3 | 2,150.5 | 2,273.3 | 2,291.9 | 2,316.9 | 2,456.3 | 2,467.1 | 2,265.0 | 2,326.4 | 2,472.0 | 2,443.6 | 2,619.1 |
| 1998 | 2,574.9 | 2,439.3 | 2,489.6 | 2,368.7 | 2,339.1 | 2,423.5 | 2,524.1 | 2,582.5 | 2,462.3 | 2,530.2 | 2,591.5 | 2,715.4 |
| 1999 | 2,635.4 | 2,521.4 | 2,188.9 | 2,104.2 | 2,101.2 | 2,180.7 | 1,910.0 | 1,762.5 | 1,646.3 | 1,725.3 | 1,600.4 | 1,745.3 |
| 2000 | 1,429.1 | 1,347.8 | 1,287.2 | 1,422.2 | 1,355.8 | 1,239.4 | 1,430.4 | 1,476.6 | 1,364.5 | 1,356.3 | 1,386.2 | 1,519.4 |
| 2001 | 1,244.7 | 1,366.5 | 1,403.5 | 1,230.8 | 1,176.9 | 1,402.9 | 1,431.1 | 1,348.8 | 1,364.8 | 1,480.9 | 1,450.7 | 1,428.6 |
| 2002 | 1,424.5 | 1,537.0 | 1,344.8 | 1,378.9 | 1,434.5 | 1,543.6 | 1,508.6 | 1,569.5 | 1,459.4 | 1,372.7 | 1,485.1 | 1,436.4 |
| 2003 | 1,292.9 | 1,164.6 | 1,165.4 | 1,324.4 | 1,492.2 | 1,540.4 | 1,539.2 | 1,456.0 | 1,407.1 | 1,464.8 | 1,489.3 | 1,500.6 |
| 2004 | 1,321.5 | 1,277.0 | 1,252.6 | 1,238.6 | 1,127.8 | 1,235.7 | 1,270.7 | 1,277.1 | 1,254.8 | 1,141.8 | 1,135.7 | 1,263.0 |
| 2005 | 1,084.4 | 1,125.7 | 1,013.6 | 1,021.5 | 1,125.0 | 1,151.7 | 1,110.2 | 1,005.0 | 927.4 | 964.6 | 1,021.2 | 971.9 |
| 2006 | 872.0 | 967.8 | 905.1 | 858.9 | 894.2 | 931.0 | 849.6 | 896.8 | 946.8 | 941.2 | 905.1 | 897.7 |
| 2007 | 828.1 | 828.9 | 860.7 | 870.9 | 766.5 | 891.3 | 881.6 | 920.0 | 881.6 | 865.2 | 793.6 | 769.3 |
| 2008 | 767.6 | 768.4 | 725.0 | 739.1 | 708.0 | 719.2 | 726.6 | 766.9 | 742.6 | 769.5 | 782.5 | 792.8 |
| 2009 | 684.5 | 684.4 | 687.9 | 709.6 | 675.3 | 662.6 | 704.8 | 692.9 | 696.1 | 646.3 | 628.6 | 611.5 |
| 2010 | 488.1 | 451.7 | 458.6 | 491.7 | 523.5 | 535.4 | 535.3 | 525.0 | 491.7 | 472.4 | 430.4 | 388.8 |
| 2011 | 350.1 | 346.5 | 344.3 | 342.5 | 376.9 | 440.3 | 457.8 | 459.3 | 458.8 | 387.1 | 355.5 | 343.8 |
| 2012 | W | 334.5 | 333.9 | 356.5 | 403.5 | 451.7 | 431.7 | 420.1 | 404.0 | W | 417.9 | W |
| 2013 | 377.1 | 361.3 | W | W | 431.8 | 444.2 | 452.5 | 475.3 | W | 427.3 | W | 405.3 |
| 2014 | 387.7 | 388.9 | 413.6 | 429.8 | 463.2 | 463.9 | 494.4 | 501.6 | 496.3 | 494.4 | 472.8 | 493.2 |
| 2015 | 460.3 | 451.0 | 457.6 | 496.5 | 520.7 | 520.3 | 556.5 | 548.3 | 541.4 | 525.8 | 520.1 | 509.1 |
| 2016 | 505.8 | 520.0 | 511.1 | 533.6 | 551.2 | 564.9 | 576.0 | 561.5 | 557.6 | 517.6 | 476.6 | 437.5 |
| 2017 | 409.6 | W | W | W | W | W | W | W | W | W | W | W |
| 2018 | W | W | W | W | W | W | W | W | W | W | W | W |
| 2019 | W | W | W | W | W | W | W | W | W | W | W | W |
| 2020 | W | W | W | W | W | W | W | W | W | W | W | W |
| 2021 | W | W | W | W | W | W | W | W | W | W | W | W |
| 2022 | W | W | W | |||||||||
| - = No Data Reported; -- = Not Applicable; NA = Not Available; W = Withheld to avoid disclosure of individual company data. |
| Release Date: 6/1/2022 |
| Next Release Date: TBD |