|
Download Data (XLS File) |
|
||||||||
|
||||||||
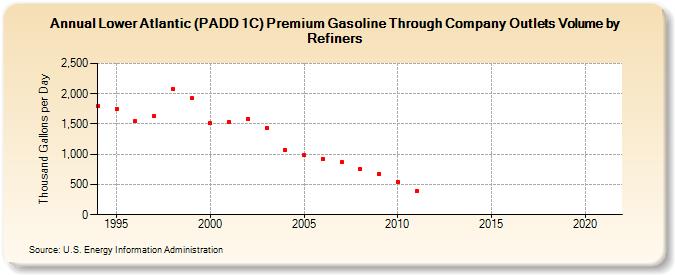
| Lower Atlantic (PADD 1C) Premium Gasoline Through Company Outlets Volume by Refiners (Thousand Gallons per Day) | ||||||||
| Decade | Year-0 | Year-1 | Year-2 | Year-3 | Year-4 | Year-5 | Year-6 | Year-7 | Year-8 | Year-9 |
|---|---|---|---|---|---|---|---|---|---|---|
| 1990's | 1,794.6 | 1,749.7 | 1,548.0 | 1,627.4 | 2,074.8 | 1,927.3 | ||||
| 2000's | 1,508.0 | 1,534.7 | 1,585.5 | 1,425.2 | 1,066.5 | 980.0 | 926.0 | 874.7 | 754.6 | 680.2 |
| 2010's | 546.6 | 391.1 | W | W | W | W | W | W | W | W |
| 2020's | W |
| - = No Data Reported; -- = Not Applicable; NA = Not Available; W = Withheld to avoid disclosure of individual company data. |
| Release Date: 6/1/2022 |
| Next Release Date: TBD |