|
Download Data (XLS File) |
|
||||||||
|
||||||||
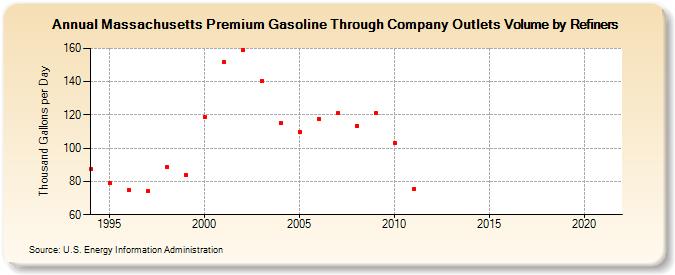
| Massachusetts Premium Gasoline Through Company Outlets Volume by Refiners (Thousand Gallons per Day) | ||||||||
| Decade | Year-0 | Year-1 | Year-2 | Year-3 | Year-4 | Year-5 | Year-6 | Year-7 | Year-8 | Year-9 |
|---|---|---|---|---|---|---|---|---|---|---|
| 1990's | 87.3 | 78.8 | 75.0 | 74.2 | 88.8 | 84.0 | ||||
| 2000's | 118.7 | 152.0 | 159.2 | 140.6 | 115.3 | 110.0 | 117.6 | 121.1 | 113.5 | 121.0 |
| 2010's | 103.4 | 75.6 | W | W | W | W | W | W | W | W |
| 2020's | W |
| - = No Data Reported; -- = Not Applicable; NA = Not Available; W = Withheld to avoid disclosure of individual company data. |
| Release Date: 6/1/2022 |
| Next Release Date: TBD |