|
Download Data (XLS File) |
|
||||||||
|
||||||||
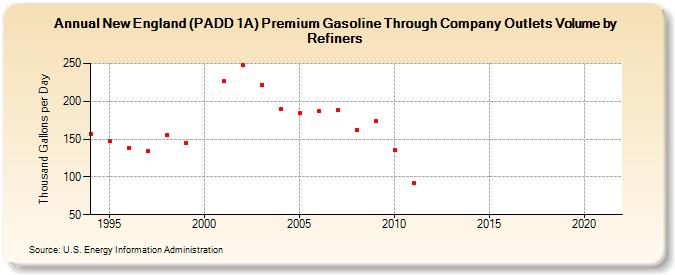
| New England (PADD 1A) Premium Gasoline Through Company Outlets Volume by Refiners (Thousand Gallons per Day) | ||||||||
| Decade | Year-0 | Year-1 | Year-2 | Year-3 | Year-4 | Year-5 | Year-6 | Year-7 | Year-8 | Year-9 |
|---|---|---|---|---|---|---|---|---|---|---|
| 1990's | 157.1 | 146.9 | 138.8 | 133.7 | 155.8 | 144.9 | ||||
| 2000's | NA | 226.3 | 247.9 | 222.2 | 189.8 | 184.5 | 186.5 | 188.7 | 161.9 | 173.6 |
| 2010's | 135.0 | 92.5 | W | W | W | W | W | W | W | W |
| 2020's | W |
| - = No Data Reported; -- = Not Applicable; NA = Not Available; W = Withheld to avoid disclosure of individual company data. |
| Release Date: 6/1/2022 |
| Next Release Date: TBD |