|
Download Data (XLS File) |
|
||||||||
|
||||||||
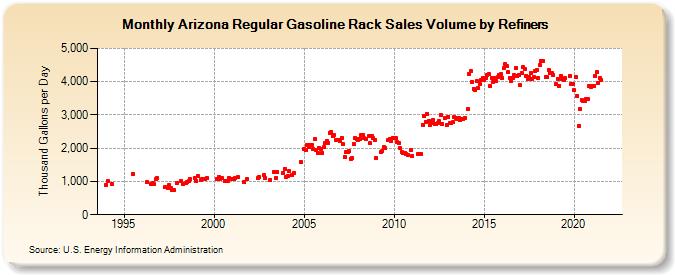
| Arizona Regular Gasoline Rack Sales Volume by Refiners (Thousand Gallons per Day) | ||||||||
| Year | Jan | Feb | Mar | Apr | May | Jun | Jul | Aug | Sep | Oct | Nov | Dec |
|---|---|---|---|---|---|---|---|---|---|---|---|---|
| 1994 | 906.1 | 1,009.2 | W | W | 910.9 | W | W | W | W | W | W | W |
| 1995 | W | W | W | W | W | W | 1,222.0 | W | W | W | W | W |
| 1996 | W | W | W | 977.3 | W | W | 914.9 | 955.8 | 914.3 | 1,063.9 | 1,099.5 | W |
| 1997 | W | W | W | 823.3 | W | 805.3 | 880.1 | 794.3 | 746.4 | 730.3 | W | 956.6 |
| 1998 | W | W | 1,019.3 | 922.2 | W | 938.4 | 978.9 | 1,024.7 | 1,060.1 | W | W | 1,107.5 |
| 1999 | 999.0 | 1,156.4 | W | 1,036.3 | 1,058.9 | W | 1,088.4 | 1,098.7 | W | W | W | W |
| 2000 | W | W | 1,081.3 | 1,140.5 | 1,087.6 | 1,096.3 | W | 1,027.8 | W | 1,003.5 | 1,099.4 | W |
| 2001 | 1,072.3 | 1,060.5 | 1,106.5 | W | 1,119.8 | W | W | W | 969.1 | W | 1,073.4 | W |
| 2002 | W | W | W | W | W | 1,099.1 | 1,140.2 | W | W | 1,188.5 | 1,103.7 | W |
| 2003 | W | 1,037.0 | W | W | 1,292.3 | 1,100.1 | 1,273.1 | W | W | W | 1,261.9 | 1,382.2 |
| 2004 | 1,128.0 | 1,165.6 | 1,304.1 | W | 1,180.4 | 1,262.9 | W | W | W | W | 1,570.8 | W |
| 2005 | 1,972.9 | 1,934.0 | 2,100.1 | 2,024.5 | 2,107.0 | 2,096.1 | 1,970.3 | 2,263.1 | 1,942.6 | 1,841.0 | 2,010.2 | 1,984.5 |
| 2006 | 1,863.0 | 2,024.6 | 2,156.7 | 2,223.6 | 2,156.2 | 2,459.8 | 2,487.3 | 2,359.4 | 2,388.2 | 2,238.9 | 2,249.2 | 2,244.3 |
| 2007 | 2,230.7 | 2,319.6 | 2,117.0 | 1,735.3 | 1,881.2 | 1,897.1 | 1,904.8 | 1,677.6 | 1,695.8 | 2,131.8 | 2,298.7 | 2,275.7 |
| 2008 | 2,249.4 | 2,270.0 | 2,382.3 | 2,399.0 | 2,295.6 | 2,274.9 | W | 2,359.5 | 2,143.4 | 2,379.5 | 2,296.2 | 2,249.0 |
| 2009 | 1,714.0 | W | W | 1,870.9 | 1,901.5 | 2,034.1 | 1,994.8 | W | 2,236.1 | 2,268.0 | 2,229.6 | 2,319.0 |
| 2010 | W | 2,310.2 | 2,193.4 | 2,150.6 | 1,999.7 | 1,888.8 | 1,848.2 | 1,867.5 | 1,839.7 | 1,793.0 | W | 1,931.2 |
| 2011 | 1,775.6 | W | W | W | 1,818.4 | 1,811.6 | 1,818.1 | 2,697.9 | 2,952.8 | 2,798.2 | 3,036.5 | 2,828.3 |
| 2012 | 2,699.0 | 2,758.0 | 2,845.1 | 2,719.8 | 2,725.6 | 2,756.6 | 2,802.7 | 3,000.2 | 2,741.2 | W | 2,911.5 | 2,710.4 |
| 2013 | 2,951.7 | 2,754.5 | 2,754.1 | 2,772.4 | 2,933.8 | 2,914.8 | 2,866.6 | 2,922.4 | 2,859.6 | 2,867.5 | 2,881.0 | 2,919.9 |
| 2014 | W | 3,175.3 | 4,232.5 | 4,309.7 | 4,001.8 | 3,791.0 | 3,756.5 | 4,015.9 | 3,795.3 | 3,930.0 | 4,061.7 | 4,123.3 |
| 2015 | 4,054.3 | 4,102.5 | 4,213.8 | 4,229.1 | 3,866.8 | 4,120.5 | 4,002.9 | 4,106.9 | 4,023.2 | 4,134.2 | 4,197.0 | 4,221.9 |
| 2016 | 4,110.6 | 4,403.4 | 4,524.0 | 4,463.1 | 4,303.0 | 4,109.3 | 4,026.6 | 4,119.7 | 4,189.5 | 4,409.5 | 4,174.0 | 4,196.2 |
| 2017 | 3,890.8 | 4,247.1 | 4,426.6 | 4,379.6 | 4,170.5 | 4,079.4 | 4,133.3 | 4,258.9 | 4,073.1 | 4,131.5 | 4,310.1 | 4,355.4 |
| 2018 | 4,121.7 | 4,498.7 | 4,632.9 | 4,624.5 | W | 4,142.3 | 4,135.1 | 4,348.6 | 4,258.5 | 4,256.7 | 4,190.3 | W |
| 2019 | 3,916.1 | 4,085.4 | 3,879.9 | 4,175.0 | 4,079.4 | 4,041.2 | 4,105.8 | W | W | 4,183.7 | 3,939.1 | 3,942.4 |
| 2020 | 3,736.4 | 4,144.4 | 3,569.9 | 2,672.5 | 3,184.4 | 3,447.4 | 3,413.2 | 3,422.1 | 3,465.1 | 3,475.9 | 3,869.3 | 3,846.6 |
| 2021 | 3,877.1 | 3,880.2 | 4,166.1 | 4,276.3 | 3,972.0 | 4,106.2 | 4,059.5 | W | W | W | W | W |
| 2022 | W | W | W | |||||||||
| - = No Data Reported; -- = Not Applicable; NA = Not Available; W = Withheld to avoid disclosure of individual company data. |
| Release Date: 6/1/2022 |
| Next Release Date: TBD |