|
Download Data (XLS File) |
|
||||||||
|
||||||||
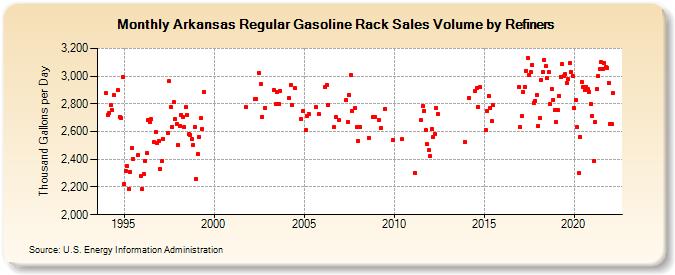
| Arkansas Regular Gasoline Rack Sales Volume by Refiners (Thousand Gallons per Day) | ||||||||
| Year | Jan | Feb | Mar | Apr | May | Jun | Jul | Aug | Sep | Oct | Nov | Dec |
|---|---|---|---|---|---|---|---|---|---|---|---|---|
| 1994 | 2,875.5 | 2,721.0 | 2,733.8 | 2,789.9 | 2,752.8 | 2,863.2 | W | W | 2,897.6 | 2,708.5 | 2,701.0 | 2,990.7 |
| 1995 | 2,223.5 | 2,317.5 | 2,350.8 | 2,184.1 | 2,310.0 | 2,480.5 | 2,403.6 | W | W | 2,428.5 | W | 2,278.9 |
| 1996 | 2,186.9 | 2,294.1 | 2,389.0 | 2,442.8 | 2,685.3 | 2,671.1 | 2,688.2 | W | 2,523.1 | 2,596.3 | 2,518.0 | 2,535.2 |
| 1997 | 2,329.2 | 2,385.2 | 2,546.7 | W | W | 2,592.2 | 2,962.9 | 2,777.3 | 2,634.8 | 2,812.9 | 2,688.3 | 2,653.9 |
| 1998 | 2,502.3 | 2,642.9 | 2,719.4 | 2,705.9 | 2,630.8 | 2,774.7 | 2,722.8 | 2,582.3 | 2,577.4 | 2,543.2 | 2,502.7 | 2,633.3 |
| 1999 | 2,260.5 | 2,439.0 | 2,563.5 | 2,696.1 | 2,617.0 | 2,888.9 | W | W | W | W | W | W |
| 2000 | W | W | W | W | W | W | W | W | W | W | W | W |
| 2001 | W | W | W | W | W | W | W | W | W | 2,775.1 | W | W |
| 2002 | W | W | W | 2,831.7 | 2,837.9 | W | 3,025.3 | 2,940.8 | 2,706.1 | W | 2,773.5 | W |
| 2003 | W | W | W | W | 2,899.4 | 2,797.6 | 2,887.1 | 2,799.4 | 2,894.8 | W | W | W |
| 2004 | W | W | 2,838.5 | 2,938.8 | 2,793.6 | W | 2,913.5 | W | W | W | 2,689.7 | 2,747.8 |
| 2005 | W | 2,611.0 | 2,713.8 | 2,728.4 | W | W | W | W | 2,775.5 | W | 2,724.3 | W |
| 2006 | W | W | 2,918.0 | 2,936.2 | 2,792.8 | W | W | W | 2,630.8 | 2,702.5 | W | 2,686.6 |
| 2007 | W | W | W | W | 2,824.5 | 2,668.6 | 2,865.3 | 3,005.8 | 2,750.8 | W | 2,768.7 | 2,632.3 |
| 2008 | 2,533.0 | 2,631.2 | W | W | W | W | W | 2,555.4 | W | W | 2,701.4 | 2,708.5 |
| 2009 | W | W | 2,684.5 | 2,623.7 | W | W | 2,763.3 | W | W | W | W | 2,536.9 |
| 2010 | W | W | W | W | W | 2,543.0 | W | W | W | W | W | W |
| 2011 | W | W | 2,302.3 | W | W | W | 2,682.0 | 2,785.4 | 2,751.6 | 2,610.0 | 2,510.1 | 2,464.9 |
| 2012 | 2,421.8 | 2,619.6 | 2,562.0 | 2,583.9 | 2,767.1 | 2,729.2 | W | W | W | W | W | W |
| 2013 | W | W | W | W | W | W | W | W | W | W | W | 2,526.6 |
| 2014 | W | W | 2,840.9 | W | W | W | 2,895.0 | 2,911.9 | 2,777.9 | 2,918.1 | W | W |
| 2015 | W | 2,613.0 | 2,749.4 | 2,855.3 | 2,767.1 | 2,672.8 | 2,789.0 | W | W | W | W | W |
| 2016 | W | W | W | W | W | W | W | W | W | W | W | 2,920.9 |
| 2017 | 2,630.7 | 2,710.9 | 2,884.5 | 2,924.9 | 3,038.9 | 3,131.6 | 3,005.3 | 3,027.7 | 3,081.2 | 2,809.6 | 2,821.6 | 2,866.7 |
| 2018 | 2,640.5 | 2,696.8 | 2,968.5 | 3,028.6 | 3,116.7 | 3,071.5 | 2,984.0 | 3,027.0 | 2,796.7 | 2,910.5 | 2,831.2 | 2,753.2 |
| 2019 | 2,667.4 | 2,756.6 | 2,858.8 | 2,995.6 | 3,084.1 | 2,997.7 | 3,015.3 | 2,952.2 | 2,976.2 | 3,092.7 | 3,029.7 | 3,004.1 |
| 2020 | 2,769.7 | 2,828.9 | 2,632.1 | 2,298.2 | 2,563.9 | 2,958.4 | 2,922.7 | 2,900.3 | 2,923.5 | 2,905.0 | 2,882.9 | 2,801.6 |
| 2021 | 2,711.5 | 2,388.8 | 2,671.7 | 2,904.5 | 2,997.7 | 3,052.3 | 3,100.6 | 3,048.9 | 3,097.0 | 3,063.8 | 3,061.9 | 2,953.0 |
| 2022 | 2,652.7 | 2,655.3 | 2,877.9 | |||||||||
| - = No Data Reported; -- = Not Applicable; NA = Not Available; W = Withheld to avoid disclosure of individual company data. |
| Release Date: 6/1/2022 |
| Next Release Date: TBD |