|
Download Data (XLS File) |
|
||||||||
|
||||||||
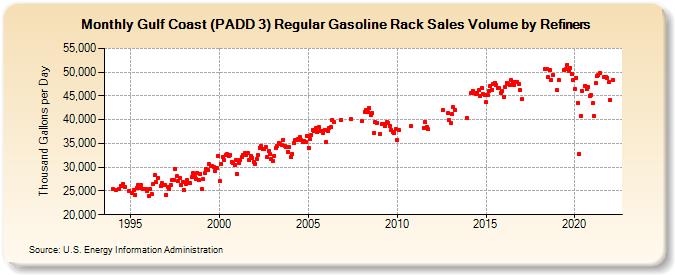
| Gulf Coast (PADD 3) Regular Gasoline Rack Sales Volume by Refiners (Thousand Gallons per Day) | ||||||||
| Year | Jan | Feb | Mar | Apr | May | Jun | Jul | Aug | Sep | Oct | Nov | Dec |
|---|---|---|---|---|---|---|---|---|---|---|---|---|
| 1994 | 25,380.3 | W | 25,302.3 | W | 25,410.3 | 26,077.3 | 26,066.5 | 26,557.9 | 25,870.5 | W | W | 25,029.9 |
| 1995 | W | 24,487.7 | 25,096.4 | 24,220.1 | 25,643.5 | 26,300.8 | 25,622.5 | 26,209.9 | 25,343.0 | 25,482.1 | 25,383.6 | 24,983.2 |
| 1996 | 23,916.2 | 25,419.3 | 24,319.9 | 26,453.4 | 28,277.3 | 26,811.7 | 27,814.9 | W | 25,957.5 | 26,605.2 | 26,191.4 | 26,305.5 |
| 1997 | 24,241.6 | 25,838.0 | 25,479.2 | 26,335.3 | 27,208.0 | 27,278.4 | 29,627.0 | 28,068.8 | 27,080.3 | 27,663.9 | 26,279.8 | 26,929.4 |
| 1998 | 25,261.9 | 26,551.1 | 27,217.9 | 26,629.0 | 26,700.5 | 27,895.5 | 28,694.8 | 27,901.4 | 27,580.9 | 28,847.3 | 27,206.6 | 28,648.9 |
| 1999 | 25,351.9 | 27,494.4 | 28,767.1 | 29,617.7 | 29,348.9 | 30,569.5 | 30,317.7 | 30,233.5 | 29,972.8 | 29,303.2 | 29,825.7 | 32,421.3 |
| 2000 | 27,021.3 | 30,769.4 | 32,165.9 | 31,499.1 | 32,476.8 | 32,681.7 | 32,281.1 | 32,473.0 | 31,062.8 | 30,852.3 | 30,446.6 | 31,482.2 |
| 2001 | 28,664.2 | 30,977.0 | 31,540.2 | 32,059.9 | 32,518.1 | 33,006.3 | 32,632.2 | 33,024.6 | 31,411.5 | 32,305.5 | 31,981.0 | 31,182.0 |
| 2002 | 30,758.5 | 31,702.0 | 32,512.9 | 34,135.9 | 34,422.4 | 33,762.1 | 33,772.5 | 34,282.9 | 32,149.6 | 33,357.7 | 32,677.4 | 31,772.3 |
| 2003 | 31,314.7 | 32,419.9 | 33,971.3 | 34,528.5 | 34,997.8 | 34,972.4 | 34,727.0 | 35,809.8 | 34,479.4 | 34,348.4 | 33,299.7 | 34,154.4 |
| 2004 | 32,138.3 | 32,818.6 | 35,078.0 | 35,777.3 | 35,643.2 | 35,957.8 | 36,293.2 | 35,688.6 | 35,393.5 | 35,579.0 | 35,278.3 | 36,666.6 |
| 2005 | 34,091.3 | 35,853.1 | 36,820.7 | 37,911.6 | 37,544.9 | 38,172.3 | 37,337.5 | 38,415.6 | 37,560.1 | 37,587.7 | 37,196.7 | 37,864.5 |
| 2006 | 35,369.5 | 37,642.8 | 38,289.8 | 38,465.2 | 39,945.1 | 39,452.6 | W | W | W | W | 39,903.3 | W |
| 2007 | W | W | W | W | W | 40,118.4 | W | W | W | W | W | W |
| 2008 | 39,672.5 | W | 41,669.9 | 42,027.7 | 41,516.6 | 42,365.4 | 40,901.7 | 41,422.2 | 37,220.1 | 39,414.2 | 39,366.9 | W |
| 2009 | 36,996.7 | W | 39,112.0 | 39,103.5 | 38,698.5 | 39,465.1 | 39,258.1 | 38,724.4 | 37,848.7 | 37,452.9 | 37,187.8 | 37,951.3 |
| 2010 | 35,655.5 | 37,764.1 | W | W | W | W | W | W | W | 38,572.9 | W | W |
| 2011 | W | W | W | W | W | W | 38,332.9 | 39,500.9 | 38,488.0 | 37,976.4 | W | W |
| 2012 | W | W | W | W | W | W | W | 42,012.5 | W | W | 41,340.0 | 39,839.0 |
| 2013 | 39,359.5 | 41,229.1 | 42,567.9 | 42,129.2 | W | W | W | W | W | W | W | 40,381.1 |
| 2014 | W | W | 45,601.9 | 46,077.7 | 45,612.4 | 45,459.8 | 45,640.1 | 46,190.1 | 45,061.8 | 46,613.2 | 45,345.8 | 45,287.1 |
| 2015 | 43,642.9 | 45,215.0 | 46,007.0 | 47,181.1 | 46,266.6 | 47,539.9 | 47,770.8 | 47,213.3 | 46,654.3 | 46,562.9 | 45,627.1 | 45,980.5 |
| 2016 | 44,672.3 | 46,778.8 | 47,715.1 | 47,543.6 | 47,327.3 | 48,379.7 | 47,834.6 | 47,395.9 | 47,968.2 | 47,883.9 | 47,432.6 | 46,184.0 |
| 2017 | 44,322.2 | W | W | W | W | W | W | W | W | W | W | W |
| 2018 | W | W | W | W | 50,745.4 | 50,729.9 | 48,943.5 | 50,358.7 | 48,412.8 | 49,444.6 | W | W |
| 2019 | 46,207.8 | 48,443.6 | W | W | W | 50,464.0 | 50,563.7 | 51,600.5 | 50,163.4 | 50,910.5 | 49,515.0 | 48,446.5 |
| 2020 | 46,499.4 | 48,828.0 | 43,514.5 | 32,864.8 | 40,852.8 | 46,026.9 | W | 47,146.4 | 46,382.5 | 46,942.2 | 44,974.6 | 45,195.6 |
| 2021 | 43,429.1 | 40,800.7 | 47,618.8 | 49,173.1 | 49,323.3 | 49,916.1 | W | W | 49,074.9 | 48,970.8 | 48,777.7 | 47,907.2 |
| 2022 | 44,140.4 | W | 48,304.6 | |||||||||
| - = No Data Reported; -- = Not Applicable; NA = Not Available; W = Withheld to avoid disclosure of individual company data. |
| Release Date: 6/1/2022 |
| Next Release Date: TBD |