|
Download Data (XLS File) |
|
||||||||
|
||||||||
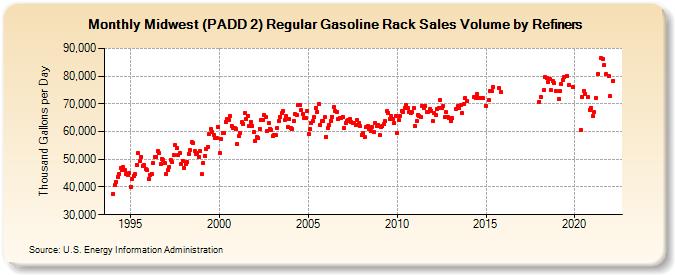
| Midwest (PADD 2) Regular Gasoline Rack Sales Volume by Refiners (Thousand Gallons per Day) | ||||||||
| Year | Jan | Feb | Mar | Apr | May | Jun | Jul | Aug | Sep | Oct | Nov | Dec |
|---|---|---|---|---|---|---|---|---|---|---|---|---|
| 1994 | 37,606.9 | 40,678.1 | 41,979.4 | 43,714.0 | 44,615.6 | 46,820.2 | 46,037.0 | 47,203.2 | 46,029.4 | 44,615.3 | 44,488.2 | 45,099.3 |
| 1995 | 40,126.2 | 42,875.1 | 44,015.0 | 44,648.6 | 48,048.8 | 52,156.4 | 49,432.0 | 50,941.5 | 47,640.0 | 47,770.5 | 46,347.0 | 45,966.1 |
| 1996 | 42,801.3 | 44,345.3 | 44,805.9 | 48,642.6 | 50,883.4 | 50,976.7 | 52,852.1 | 52,225.0 | 48,121.7 | 50,249.6 | 49,808.7 | 48,563.1 |
| 1997 | 44,657.0 | 46,002.1 | 47,235.7 | 49,798.5 | 48,991.4 | 51,698.0 | 55,124.2 | 53,909.3 | 51,381.2 | 52,251.1 | 48,188.3 | 49,467.2 |
| 1998 | 46,841.5 | 48,191.8 | 48,929.9 | 51,977.1 | 53,274.0 | 56,053.8 | 55,884.6 | 52,961.2 | 51,998.4 | 52,224.7 | 50,976.6 | 52,871.9 |
| 1999 | 44,596.4 | 48,784.0 | 51,289.3 | 53,715.7 | 54,600.0 | 59,039.2 | 60,826.1 | 59,719.1 | 58,878.8 | 57,814.8 | 57,703.1 | 61,808.9 |
| 2000 | 52,119.6 | 57,428.1 | 59,471.5 | 59,616.3 | 63,618.8 | 64,569.6 | 64,177.0 | 65,599.3 | 62,044.6 | 61,300.0 | 61,321.2 | 60,868.1 |
| 2001 | 55,540.7 | 58,498.0 | 59,485.2 | 63,284.3 | 62,859.7 | 66,729.9 | 64,538.0 | 65,754.6 | 62,096.9 | 63,588.9 | 62,063.1 | 59,968.5 |
| 2002 | 56,459.0 | 58,113.4 | 57,816.8 | 61,085.0 | 64,047.1 | 64,202.6 | 65,902.0 | 65,377.5 | 60,183.7 | 63,246.6 | 61,013.4 | 60,531.0 |
| 2003 | 58,444.5 | 58,856.3 | 58,753.8 | 61,223.8 | 63,911.3 | 65,358.6 | 66,614.6 | 67,350.1 | 64,343.3 | 65,507.8 | 61,710.8 | 64,523.1 |
| 2004 | 61,170.3 | 60,993.0 | 63,677.7 | 66,309.8 | 66,005.7 | 69,456.6 | 69,428.6 | 67,701.4 | 66,266.4 | 64,896.9 | 64,962.5 | 67,527.5 |
| 2005 | 59,072.0 | 60,802.8 | 62,950.1 | 63,759.9 | 65,143.6 | 68,406.9 | 67,092.3 | 69,794.7 | 62,433.1 | 63,708.3 | 63,894.6 | 65,078.5 |
| 2006 | 58,162.2 | 61,430.5 | 62,469.7 | 63,914.3 | 65,411.0 | 68,855.5 | 67,516.2 | 67,037.5 | 64,494.6 | 64,744.4 | 64,876.3 | 65,330.6 |
| 2007 | 61,252.7 | 63,147.6 | 63,722.2 | 64,232.3 | 64,352.1 | 63,604.2 | 62,991.9 | 63,258.9 | 62,197.9 | 64,136.6 | 63,249.1 | 61,825.2 |
| 2008 | 58,887.4 | 59,448.8 | 57,869.2 | 61,556.0 | 62,017.6 | 61,060.7 | 60,299.6 | 61,744.0 | 60,011.9 | 63,112.2 | 62,151.5 | 62,410.7 |
| 2009 | 58,580.1 | 61,567.9 | 61,886.3 | 62,668.1 | 63,715.7 | 67,298.3 | 66,642.8 | 64,543.7 | 65,538.3 | 64,539.4 | 62,954.5 | 65,665.0 |
| 2010 | 59,537.7 | 63,994.1 | 65,639.3 | 67,350.4 | 67,120.8 | 68,593.3 | 69,594.0 | 68,462.2 | 67,081.9 | 66,602.2 | 67,026.2 | 68,406.5 |
| 2011 | 62,082.1 | 63,788.8 | 66,122.0 | 65,673.0 | 65,352.2 | 69,084.5 | 68,510.4 | 69,170.0 | 67,014.7 | 66,943.0 | 67,978.5 | 67,541.3 |
| 2012 | 63,763.3 | 66,815.1 | 65,848.5 | 68,000.9 | 68,338.7 | 71,323.2 | 68,582.9 | 69,143.9 | 65,161.1 | 67,038.0 | 65,080.8 | 65,016.5 |
| 2013 | 63,653.2 | 64,773.7 | W | W | 68,303.3 | 69,074.2 | 68,529.6 | 69,601.0 | 66,655.6 | 69,994.1 | 72,016.7 | 71,028.2 |
| 2014 | W | W | W | W | 72,533.8 | 71,937.9 | 73,604.8 | 72,242.1 | W | 72,189.1 | 72,081.5 | W |
| 2015 | 69,357.7 | W | 71,207.0 | 74,685.3 | 74,685.2 | 76,109.3 | W | W | W | 75,538.6 | 74,360.7 | W |
| 2016 | W | W | W | W | W | W | W | W | W | W | W | W |
| 2017 | W | W | W | W | W | W | W | W | W | W | W | W |
| 2018 | 70,751.7 | 72,376.5 | W | 74,826.4 | 79,717.5 | 79,445.9 | 77,710.8 | 79,109.4 | 74,884.3 | 78,314.1 | 77,515.8 | 74,805.3 |
| 2019 | W | 71,619.5 | 74,500.4 | 76,993.8 | 78,550.2 | 79,539.6 | W | 80,059.7 | 76,850.7 | W | W | 76,056.7 |
| 2020 | W | W | W | W | 60,395.0 | 72,629.0 | 74,764.0 | 73,718.1 | W | 72,530.5 | 67,952.9 | 68,590.3 |
| 2021 | 65,441.2 | 67,076.1 | 71,990.4 | W | 80,847.7 | W | 86,383.9 | 86,281.9 | 84,003.6 | 80,617.9 | W | 79,974.5 |
| 2022 | 72,673.8 | W | 78,355.1 | |||||||||
| - = No Data Reported; -- = Not Applicable; NA = Not Available; W = Withheld to avoid disclosure of individual company data. |
| Release Date: 6/1/2022 |
| Next Release Date: TBD |