|
Download Data (XLS File) |
|
||||||||
|
||||||||
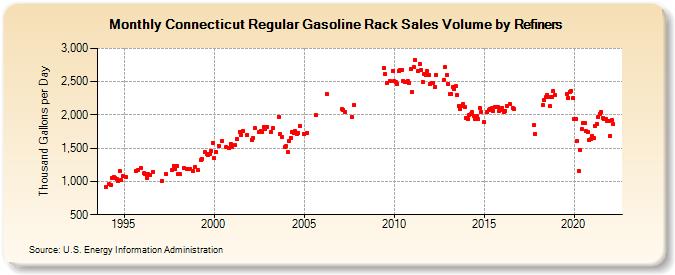
| Connecticut Regular Gasoline Rack Sales Volume by Refiners (Thousand Gallons per Day) | ||||||||
| Year | Jan | Feb | Mar | Apr | May | Jun | Jul | Aug | Sep | Oct | Nov | Dec |
|---|---|---|---|---|---|---|---|---|---|---|---|---|
| 1994 | 917.6 | W | 957.5 | 951.6 | 1,054.0 | 1,064.3 | 1,051.9 | 1,034.5 | 1,008.2 | 1,154.5 | 1,021.0 | 1,086.8 |
| 1995 | W | 1,066.5 | W | W | W | W | W | W | 1,158.5 | 1,165.0 | W | 1,202.7 |
| 1996 | W | 1,119.7 | 1,111.1 | 1,052.0 | 1,106.0 | 1,099.0 | W | 1,146.0 | W | W | W | W |
| 1997 | W | 1,013.3 | W | W | 1,113.0 | W | W | W | 1,178.6 | 1,235.7 | 1,188.9 | 1,229.1 |
| 1998 | 1,105.4 | 1,105.1 | W | W | 1,201.5 | W | 1,187.4 | W | 1,187.0 | W | 1,151.9 | 1,218.2 |
| 1999 | W | 1,175.3 | W | 1,323.6 | 1,341.3 | W | 1,437.9 | 1,406.3 | 1,397.9 | 1,417.0 | 1,464.8 | 1,582.6 |
| 2000 | 1,352.8 | 1,437.2 | W | 1,539.0 | W | 1,604.3 | W | W | 1,513.3 | W | 1,505.1 | 1,568.8 |
| 2001 | 1,514.4 | W | 1,547.3 | 1,638.5 | W | 1,745.9 | 1,700.5 | 1,757.3 | W | W | 1,701.3 | W |
| 2002 | W | 1,628.2 | 1,654.5 | 1,799.1 | W | W | 1,744.4 | 1,764.7 | 1,740.0 | 1,822.6 | 1,789.7 | 1,824.7 |
| 2003 | W | W | 1,744.4 | 1,796.0 | W | W | W | 1,973.8 | 1,705.8 | 1,674.6 | W | 1,515.3 |
| 2004 | 1,525.7 | 1,437.7 | 1,606.8 | 1,656.0 | 1,746.8 | 1,728.7 | 1,750.8 | 1,713.5 | 1,734.9 | 1,840.3 | W | W |
| 2005 | 1,706.8 | W | 1,733.3 | W | W | W | W | W | 1,993.4 | W | W | W |
| 2006 | W | W | W | 2,316.8 | W | W | W | W | W | W | W | W |
| 2007 | W | 2,082.7 | 2,074.5 | 2,049.5 | W | W | W | W | 1,969.3 | 2,149.9 | W | W |
| 2008 | W | W | W | W | W | W | W | W | W | W | W | W |
| 2009 | W | W | W | W | W | 2,704.9 | 2,619.6 | 2,477.1 | W | 2,508.6 | W | 2,666.9 |
| 2010 | 2,508.3 | 2,501.2 | 2,468.6 | 2,657.6 | 2,674.5 | 2,678.1 | 2,510.1 | 2,493.5 | W | 2,516.3 | 2,484.6 | 2,687.5 |
| 2011 | 2,340.8 | 2,717.1 | 2,826.0 | NA | 2,664.2 | 2,772.8 | 2,677.3 | 2,499.2 | 2,620.1 | 2,605.9 | 2,653.8 | 2,604.9 |
| 2012 | 2,468.9 | 2,480.0 | 2,480.9 | 2,423.5 | 2,606.3 | W | W | W | W | 2,518.2 | 2,718.0 | 2,597.3 |
| 2013 | 2,468.0 | 2,312.4 | 2,315.3 | 2,418.4 | 2,390.7 | 2,434.0 | 2,295.0 | 2,131.2 | 2,095.1 | 2,139.1 | 2,166.2 | 2,117.7 |
| 2014 | 1,951.4 | 1,942.1 | 1,995.1 | 2,010.4 | 2,039.9 | 1,985.7 | 1,945.6 | 1,979.5 | 1,937.6 | 2,103.1 | 2,047.4 | W |
| 2015 | 1,897.3 | W | 2,042.9 | 2,070.5 | 2,091.6 | 2,102.0 | 2,062.3 | 2,120.1 | W | 2,123.3 | 2,059.3 | 2,076.6 |
| 2016 | 2,108.3 | 2,041.5 | 2,064.9 | 2,141.1 | W | 2,165.2 | W | 2,107.1 | 2,086.8 | W | W | W |
| 2017 | W | W | W | W | W | W | W | W | W | 1,843.0 | 1,719.8 | W |
| 2018 | W | W | W | 2,147.2 | 2,217.4 | 2,263.1 | 2,292.8 | 2,262.8 | 2,128.4 | 2,275.9 | 2,353.9 | 2,302.5 |
| 2019 | W | W | W | W | W | W | W | 2,312.3 | 2,254.6 | 2,345.7 | 2,360.6 | 2,249.6 |
| 2020 | 1,935.0 | 1,937.5 | 1,601.9 | 1,163.1 | 1,473.3 | 1,785.2 | 1,883.5 | 1,875.2 | 1,765.4 | 1,743.2 | 1,623.6 | 1,630.6 |
| 2021 | 1,682.5 | 1,647.0 | 1,833.8 | 1,865.6 | 1,968.8 | 2,020.9 | 2,046.2 | 1,956.8 | 1,934.6 | 1,938.6 | 1,909.9 | 1,913.3 |
| 2022 | 1,689.5 | 1,920.2 | 1,858.0 | |||||||||
| - = No Data Reported; -- = Not Applicable; NA = Not Available; W = Withheld to avoid disclosure of individual company data. |
| Release Date: 6/1/2022 |
| Next Release Date: TBD |