|
Download Data (XLS File) |
|
||||||||
|
||||||||
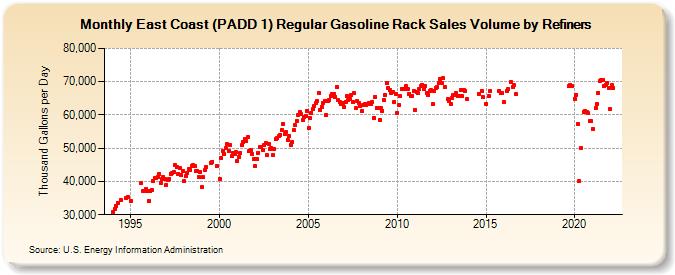
| East Coast (PADD 1) Regular Gasoline Rack Sales Volume by Refiners (Thousand Gallons per Day) | ||||||||
| Year | Jan | Feb | Mar | Apr | May | Jun | Jul | Aug | Sep | Oct | Nov | Dec |
|---|---|---|---|---|---|---|---|---|---|---|---|---|
| 1994 | 30,928.0 | 31,784.0 | 32,481.6 | 33,393.5 | W | 34,348.4 | W | W | W | 34,883.2 | 35,453.6 | W |
| 1995 | 34,240.3 | W | W | W | W | W | W | 39,401.4 | 37,111.0 | 37,075.9 | 37,707.1 | 37,016.8 |
| 1996 | 34,245.5 | 37,020.1 | 37,540.1 | 40,082.4 | 40,992.2 | 40,932.1 | 41,425.1 | 42,256.4 | 39,523.4 | 40,642.2 | 41,380.6 | 40,745.3 |
| 1997 | 38,945.6 | 40,521.8 | 40,664.2 | 42,374.7 | 42,648.4 | 42,970.6 | 44,849.8 | 44,339.2 | 42,307.0 | 44,137.5 | 41,926.2 | 43,146.6 |
| 1998 | 40,018.5 | 41,536.1 | 42,392.8 | 43,766.1 | 43,573.8 | 44,693.2 | 44,797.0 | 44,599.7 | 43,074.3 | 43,191.4 | 41,409.9 | 42,811.0 |
| 1999 | 38,256.2 | 41,231.9 | 43,301.5 | 44,297.5 | W | W | 45,565.1 | 45,942.9 | W | W | 44,603.2 | W |
| 2000 | 40,875.8 | 47,007.8 | 49,138.7 | 48,396.1 | 49,912.5 | 51,246.4 | 49,300.0 | 50,988.4 | 47,568.8 | 48,667.5 | 48,155.8 | 48,819.5 |
| 2001 | 46,201.4 | 47,359.1 | 48,546.9 | 50,812.5 | 51,929.4 | 52,702.8 | 52,025.3 | 53,248.7 | 49,009.1 | 49,317.8 | 48,201.4 | 46,791.7 |
| 2002 | 44,506.2 | 46,793.2 | 48,570.1 | 50,226.5 | 50,479.7 | 49,525.2 | 50,841.5 | 51,664.4 | 47,808.8 | 51,402.6 | 49,879.1 | 50,099.7 |
| 2003 | 48,024.4 | 49,645.0 | 52,730.4 | 53,134.5 | 53,544.8 | 53,996.4 | 55,424.6 | 57,370.5 | 54,173.6 | 54,874.2 | 52,379.3 | 53,691.4 |
| 2004 | 50,941.5 | 51,981.5 | 55,539.9 | 56,961.9 | 58,131.3 | 59,942.8 | 60,805.5 | 60,135.2 | 58,482.5 | 59,337.9 | 59,599.4 | 61,171.8 |
| 2005 | 56,003.9 | 59,112.6 | 60,705.4 | 61,759.4 | 62,679.0 | 63,476.3 | 64,093.2 | 66,661.3 | 61,495.0 | 62,460.0 | 63,721.1 | 64,178.5 |
| 2006 | 59,935.3 | 64,196.6 | 64,433.4 | 65,590.3 | 66,254.0 | 66,298.3 | 65,481.4 | 68,434.4 | 64,387.5 | 63,748.9 | 63,234.7 | 63,592.9 |
| 2007 | 62,381.6 | 63,964.5 | 65,554.3 | 64,553.4 | 64,934.4 | 65,911.0 | 63,805.6 | 66,482.2 | 61,982.5 | 64,126.0 | 63,522.7 | 62,738.7 |
| 2008 | 61,232.6 | 62,849.1 | 63,347.3 | 63,080.6 | 63,267.2 | 63,681.8 | 63,210.2 | 63,819.9 | 59,183.9 | 65,515.0 | 62,188.2 | 62,010.4 |
| 2009 | 58,566.0 | 61,960.0 | 61,264.7 | 64,616.6 | 65,923.5 | 69,496.7 | 68,237.1 | 67,491.6 | 66,511.3 | 66,846.1 | 64,033.1 | 66,358.5 |
| 2010 | 60,596.5 | 62,994.1 | 65,568.8 | 67,836.2 | 67,806.4 | 67,730.6 | 68,674.9 | 67,825.0 | 66,427.4 | 65,775.3 | 65,741.0 | 67,158.7 |
| 2011 | 61,601.9 | 66,880.1 | 66,549.6 | 67,763.6 | 68,612.6 | 69,060.0 | 67,923.6 | 68,750.6 | 66,645.4 | 66,040.1 | 67,161.1 | 67,387.0 |
| 2012 | 63,236.4 | 67,082.5 | 68,086.5 | 68,316.1 | 69,550.4 | 70,754.1 | 69,734.9 | 70,952.5 | 68,425.8 | W | 64,686.7 | 64,221.3 |
| 2013 | 63,217.3 | 65,155.3 | 65,845.3 | 65,874.9 | 66,498.4 | 65,789.2 | 65,768.6 | 67,630.7 | 65,559.6 | 67,444.7 | 67,118.8 | 64,793.0 |
| 2014 | W | W | W | W | W | W | W | 66,403.8 | W | 67,198.2 | 65,241.2 | W |
| 2015 | 63,213.8 | W | 65,581.0 | 67,133.4 | W | W | W | W | W | 67,258.7 | 66,554.4 | 66,542.9 |
| 2016 | 63,878.1 | W | 67,048.0 | 67,830.8 | W | 69,856.4 | 68,393.4 | 68,890.4 | 66,232.0 | W | W | W |
| 2017 | W | W | W | W | W | W | W | W | W | W | W | W |
| 2018 | W | W | W | W | W | W | W | W | W | W | W | W |
| 2019 | W | W | W | W | W | W | W | W | 68,562.1 | 69,041.1 | 68,703.9 | W |
| 2020 | 64,846.6 | 66,113.1 | 57,297.0 | 40,034.3 | 49,921.3 | W | 60,880.2 | 61,033.8 | 60,835.4 | 60,535.4 | 58,142.3 | 58,164.2 |
| 2021 | 55,750.3 | W | 62,142.6 | 63,325.5 | 66,602.9 | 70,150.8 | 70,562.6 | 70,620.4 | 68,605.6 | 68,927.0 | 69,583.3 | 68,236.8 |
| 2022 | 61,697.8 | 68,884.3 | 68,177.5 | |||||||||
| - = No Data Reported; -- = Not Applicable; NA = Not Available; W = Withheld to avoid disclosure of individual company data. |
| Release Date: 6/1/2022 |
| Next Release Date: TBD |