|
Download Data (XLS File) |
|
||||||||
|
||||||||
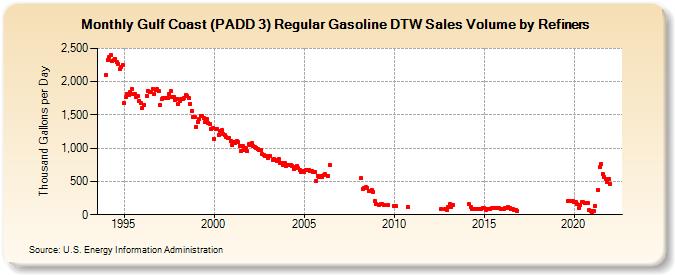
| Gulf Coast (PADD 3) Regular Gasoline DTW Sales Volume by Refiners (Thousand Gallons per Day) | ||||||||
| Year | Jan | Feb | Mar | Apr | May | Jun | Jul | Aug | Sep | Oct | Nov | Dec |
|---|---|---|---|---|---|---|---|---|---|---|---|---|
| 1994 | 2,106.6 | 2,327.7 | 2,363.4 | 2,399.1 | 2,311.3 | 2,321.8 | 2,343.8 | 2,294.4 | 2,272.2 | 2,184.6 | 2,227.0 | 2,243.9 |
| 1995 | 1,677.1 | 1,762.9 | 1,814.3 | 1,791.9 | 1,837.4 | 1,891.7 | 1,809.1 | 1,810.0 | 1,767.4 | 1,780.1 | 1,712.5 | 1,681.5 |
| 1996 | 1,601.5 | 1,649.4 | W | 1,791.7 | 1,865.3 | 1,850.3 | 1,851.2 | 1,887.5 | 1,813.7 | 1,869.5 | 1,887.3 | 1,858.6 |
| 1997 | 1,648.4 | 1,742.1 | 1,759.9 | 1,753.8 | 1,761.5 | 1,751.3 | 1,810.2 | 1,856.7 | 1,772.8 | 1,775.0 | 1,722.0 | 1,740.5 |
| 1998 | 1,657.6 | 1,702.6 | 1,741.5 | 1,737.1 | 1,757.9 | 1,798.7 | 1,786.8 | 1,747.1 | 1,668.1 | 1,560.3 | 1,468.9 | 1,463.2 |
| 1999 | 1,324.3 | 1,400.0 | 1,432.6 | 1,487.0 | 1,478.9 | 1,447.1 | 1,391.2 | 1,440.9 | 1,377.8 | 1,368.5 | 1,294.6 | 1,308.2 |
| 2000 | 1,142.0 | 1,281.7 | 1,294.3 | 1,195.2 | 1,250.9 | 1,267.4 | 1,214.5 | 1,205.0 | 1,166.1 | 1,158.4 | 1,152.4 | 1,106.6 |
| 2001 | 1,041.3 | 1,095.5 | 1,072.4 | 1,110.1 | 1,090.5 | 1,034.4 | 952.6 | 1,026.6 | 966.4 | 1,005.1 | 954.7 | 1,057.2 |
| 2002 | 1,041.4 | 1,071.4 | 1,036.8 | 1,014.0 | 1,007.4 | 988.7 | 974.3 | 975.2 | 914.2 | 901.9 | 889.0 | 880.3 |
| 2003 | 851.4 | 878.3 | W | 824.6 | 832.7 | 819.3 | 812.8 | 831.9 | 772.4 | 770.7 | 744.8 | 777.5 |
| 2004 | 729.9 | 742.7 | 744.9 | 752.7 | 736.3 | 683.9 | 720.0 | 735.5 | 704.8 | 679.5 | 640.9 | 649.8 |
| 2005 | 635.7 | 667.8 | 668.8 | 667.6 | 661.2 | 657.6 | 642.1 | 646.5 | 503.6 | 586.8 | 560.9 | 585.5 |
| 2006 | 573.7 | 595.4 | 605.4 | W | 581.0 | 744.0 | W | W | W | W | W | W |
| 2007 | W | W | W | W | W | W | W | W | W | W | W | W |
| 2008 | W | W | 550.4 | 393.3 | 404.8 | 410.5 | 402.0 | 357.3 | 359.4 | 370.6 | 347.2 | 204.1 |
| 2009 | 161.6 | W | 149.6 | 155.3 | 160.3 | 152.6 | W | W | 150.4 | W | W | W |
| 2010 | 126.6 | 126.0 | W | W | W | W | W | W | W | 117.7 | W | W |
| 2011 | W | W | W | W | W | W | W | W | W | W | W | W |
| 2012 | W | W | W | W | W | W | W | 82.6 | W | W | 83.0 | 69.2 |
| 2013 | 117.1 | 163.8 | 114.4 | 144.9 | W | W | W | W | W | W | W | W |
| 2014 | W | W | 155.6 | 114.5 | 88.5 | 91.5 | 91.2 | 91.7 | 82.9 | 87.4 | 89.3 | 105.7 |
| 2015 | 95.6 | 74.9 | 85.0 | 89.9 | 86.6 | 96.9 | 101.6 | 97.7 | 96.3 | 97.4 | 93.7 | 90.9 |
| 2016 | 80.5 | 89.0 | 100.9 | 105.0 | 109.9 | 104.9 | 83.6 | 82.2 | 76.6 | 73.4 | 60.4 | W |
| 2017 | W | W | W | W | W | W | W | W | W | W | W | W |
| 2018 | W | W | W | W | W | W | W | W | W | W | W | W |
| 2019 | W | W | W | W | W | W | W | W | 205.3 | 203.5 | W | 201.4 |
| 2020 | 184.8 | 184.6 | 160.2 | 97.0 | 139.5 | 183.9 | 184.5 | 178.0 | 178.3 | 180.7 | 63.9 | 60.4 |
| 2021 | 45.3 | 49.0 | 125.6 | W | 376.2 | 710.4 | 760.4 | 618.5 | 568.2 | 534.8 | 498.0 | 542.6 |
| 2022 | 459.2 | W | W | |||||||||
| - = No Data Reported; -- = Not Applicable; NA = Not Available; W = Withheld to avoid disclosure of individual company data. |
| Release Date: 6/1/2022 |
| Next Release Date: TBD |