|
Download Data (XLS File) |
|
||||||||
|
||||||||
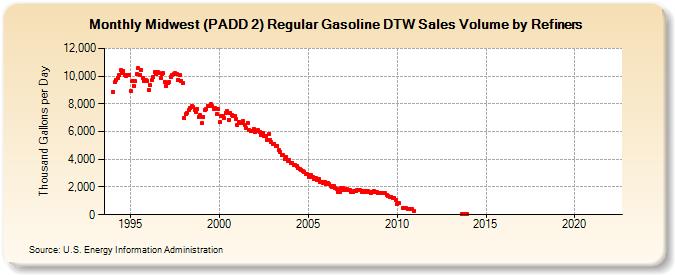
| Midwest (PADD 2) Regular Gasoline DTW Sales Volume by Refiners (Thousand Gallons per Day) | ||||||||
| Year | Jan | Feb | Mar | Apr | May | Jun | Jul | Aug | Sep | Oct | Nov | Dec |
|---|---|---|---|---|---|---|---|---|---|---|---|---|
| 1994 | 8,872.1 | 9,543.2 | 9,731.7 | 9,844.4 | 10,050.9 | 10,421.0 | 10,211.4 | 10,375.9 | 10,095.4 | 10,026.4 | 10,050.8 | 10,065.2 |
| 1995 | 8,898.0 | 9,620.3 | 9,308.5 | 9,614.0 | 10,138.5 | 10,554.7 | 10,068.5 | 10,434.2 | 9,864.4 | 9,633.3 | 9,718.8 | 9,671.9 |
| 1996 | 9,030.4 | 9,336.7 | 9,684.7 | 9,935.1 | 10,286.5 | 10,156.1 | 10,278.6 | 10,210.5 | 9,867.6 | 10,124.2 | 10,192.4 | 9,604.5 |
| 1997 | 9,267.2 | 9,487.3 | 9,579.5 | 9,958.9 | 10,085.3 | 10,120.5 | 10,189.2 | 10,119.9 | 9,743.1 | 10,108.2 | 9,671.6 | 9,530.7 |
| 1998 | 6,995.0 | 7,236.1 | 7,360.2 | 7,550.0 | 7,679.8 | 7,835.6 | 7,772.0 | 7,570.4 | 7,440.9 | 7,637.2 | 7,085.1 | 7,172.0 |
| 1999 | 6,590.0 | 7,064.9 | 7,577.5 | 7,655.1 | 7,819.6 | 7,869.5 | 7,957.3 | 7,817.6 | 7,622.8 | 7,714.8 | 7,238.7 | 7,628.9 |
| 2000 | 6,686.2 | 7,139.6 | 7,127.4 | 6,959.1 | 7,373.0 | 7,464.2 | 6,863.8 | 7,356.4 | 7,196.6 | 7,128.3 | 7,145.6 | 6,922.7 |
| 2001 | 6,485.5 | 6,696.8 | 6,604.3 | 6,602.6 | 6,774.4 | 6,500.6 | 6,250.0 | 6,651.1 | 6,135.7 | 6,047.9 | 6,046.8 | 6,169.5 |
| 2002 | 5,952.6 | 6,007.5 | 6,092.0 | 5,997.9 | 5,786.4 | 5,882.1 | 5,659.5 | 5,672.9 | 5,386.0 | 5,803.3 | 5,405.3 | 5,224.7 |
| 2003 | 5,085.6 | 5,132.4 | 4,959.2 | 4,978.2 | 4,647.5 | 4,546.7 | 4,302.8 | 4,285.6 | 3,986.5 | 4,141.2 | 3,897.0 | 3,961.7 |
| 2004 | 3,752.7 | 3,733.7 | 3,554.9 | 3,593.3 | 3,550.1 | 3,343.1 | 3,305.3 | 3,238.6 | 3,153.7 | 3,088.7 | 2,959.5 | 2,949.6 |
| 2005 | 2,746.1 | 2,850.9 | 2,837.9 | 2,694.5 | 2,597.1 | 2,615.6 | 2,484.8 | 2,550.7 | 2,394.4 | 2,352.2 | 2,276.8 | 2,359.0 |
| 2006 | 2,183.7 | 2,311.8 | 2,196.3 | 2,092.3 | 1,979.7 | 2,104.3 | 1,948.6 | 1,853.6 | 1,655.2 | 1,634.7 | 1,954.7 | 1,960.6 |
| 2007 | 1,763.5 | 1,869.9 | 1,819.2 | 1,812.6 | 1,765.7 | 1,656.9 | 1,611.6 | 1,676.7 | 1,701.9 | 1,782.3 | 1,773.0 | 1,777.7 |
| 2008 | 1,662.6 | 1,683.8 | 1,644.0 | 1,738.4 | 1,709.4 | 1,618.0 | 1,563.0 | 1,632.3 | 1,707.9 | 1,655.5 | 1,620.3 | 1,564.3 |
| 2009 | 1,579.7 | 1,584.3 | 1,552.8 | 1,557.8 | 1,541.2 | 1,430.4 | 1,331.2 | 1,313.2 | 1,294.2 | 1,230.8 | 1,228.0 | 1,076.4 |
| 2010 | 792.4 | 852.9 | W | W | 466.9 | 458.9 | 467.6 | 416.0 | 392.0 | 411.0 | 394.1 | 294.1 |
| 2011 | W | W | W | W | W | W | W | W | W | W | W | W |
| 2012 | W | W | W | W | W | W | W | W | W | W | W | W |
| 2013 | W | W | W | W | W | W | W | W | 45.0 | 48.7 | 56.8 | 57.4 |
| 2014 | W | W | W | W | W | W | W | W | W | W | W | W |
| 2015 | W | W | W | W | W | W | W | W | W | W | W | W |
| 2016 | W | W | W | W | W | W | W | W | W | W | W | W |
| 2017 | W | W | W | W | W | W | W | W | W | W | W | W |
| 2018 | W | W | W | NA | - | - | - | - | - | - | - | - |
| 2019 | - | - | - | - | - | - | - | - | - | - | - | - |
| 2020 | - | - | - | - | - | W | W | W | W | W | W | W |
| 2021 | W | W | W | W | W | - | W | W | W | - | - | - |
| 2022 | - | - | - | |||||||||
| - = No Data Reported; -- = Not Applicable; NA = Not Available; W = Withheld to avoid disclosure of individual company data. |
| Release Date: 6/1/2022 |
| Next Release Date: TBD |