|
Download Data (XLS File) |
|
||||||||
|
||||||||
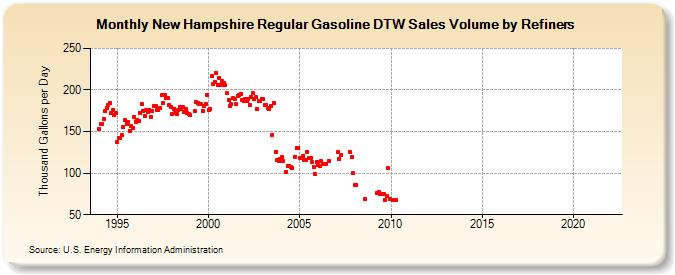
| New Hampshire Regular Gasoline DTW Sales Volume by Refiners (Thousand Gallons per Day) | ||||||||
| Year | Jan | Feb | Mar | Apr | May | Jun | Jul | Aug | Sep | Oct | Nov | Dec |
|---|---|---|---|---|---|---|---|---|---|---|---|---|
| 1994 | 152.9 | 158.6 | 158.8 | 164.9 | 175.1 | 178.4 | 181.6 | 184.3 | 172.9 | 176.1 | 169.7 | 171.8 |
| 1995 | 137.9 | 142.7 | 142.4 | 145.8 | 154.9 | 163.4 | 159.6 | 161.5 | 150.8 | 156.2 | 154.7 | 167.2 |
| 1996 | 161.7 | 163.5 | 162.6 | 171.9 | 182.7 | 174.6 | 169.3 | 175.5 | 173.6 | 176.4 | 168.0 | 174.5 |
| 1997 | 180.5 | 180.2 | 176.3 | 175.6 | 178.0 | 193.7 | 184.8 | 194.2 | 190.5 | 190.4 | 181.9 | 180.0 |
| 1998 | 171.4 | 177.1 | 171.8 | 171.7 | 176.0 | 180.0 | 177.2 | 179.5 | 173.8 | 177.0 | 172.4 | 171.6 |
| 1999 | 169.9 | W | W | 174.6 | 185.8 | 184.7 | 183.3 | 182.7 | 175.2 | 180.6 | 183.7 | 193.7 |
| 2000 | 176.4 | 177.6 | 216.8 | 207.3 | 209.7 | 220.8 | 205.5 | 214.5 | 206.0 | 210.3 | 208.7 | 205.4 |
| 2001 | 196.4 | 188.5 | 180.7 | 182.8 | 190.2 | 189.3 | 182.8 | 192.9 | 194.1 | 195.1 | 187.4 | 187.2 |
| 2002 | 189.5 | 187.3 | 189.5 | 182.1 | 192.0 | 196.3 | 189.5 | 191.2 | 176.7 | 187.2 | 186.2 | 189.5 |
| 2003 | 188.9 | 182.1 | 181.7 | 178.6 | 176.8 | 181.2 | 145.9 | 184.4 | 126.0 | 115.4 | 114.4 | 117.3 |
| 2004 | 119.0 | 114.7 | W | 101.9 | 109.1 | 108.9 | 107.5 | 106.0 | W | 119.5 | 129.8 | 130.6 |
| 2005 | 118.4 | W | 121.1 | 115.2 | 115.6 | 125.8 | 118.1 | 118.1 | 113.9 | 107.7 | 98.9 | 113.7 |
| 2006 | 109.8 | 108.9 | 114.5 | 110.9 | 111.4 | 111.3 | W | 115.1 | W | W | W | W |
| 2007 | W | 125.6 | 116.9 | 121.6 | W | W | W | W | W | 124.9 | 119.6 | 100.2 |
| 2008 | 85.5 | 85.6 | W | W | W | W | W | 69.1 | W | W | W | W |
| 2009 | W | W | W | 76.6 | 77.6 | 75.5 | 75.3 | 74.6 | 68.0 | 73.1 | 106.5 | 69.1 |
| 2010 | W | 68.1 | 67.6 | 67.1 | W | W | W | W | W | W | W | W |
| 2011 | W | W | W | W | W | W | W | W | W | W | W | W |
| 2012 | W | W | W | W | W | W | W | W | W | - | - | - |
| 2013 | - | - | - | - | - | - | - | - | - | - | - | - |
| 2014 | - | - | - | - | - | - | - | - | - | - | - | - |
| 2015 | - | - | - | - | - | - | - | - | - | - | - | - |
| 2016 | - | - | - | - | - | W | W | W | W | W | W | W |
| 2017 | W | W | W | W | W | W | W | W | W | W | W | W |
| 2018 | W | W | W | W | W | W | W | W | W | W | W | W |
| 2019 | W | W | W | W | W | W | W | W | W | W | W | W |
| 2020 | W | W | W | W | W | W | W | W | W | W | W | W |
| 2021 | W | W | W | W | W | W | W | W | W | W | W | W |
| 2022 | W | W | W | |||||||||
| - = No Data Reported; -- = Not Applicable; NA = Not Available; W = Withheld to avoid disclosure of individual company data. |
| Release Date: 6/1/2022 |
| Next Release Date: TBD |