|
Download Data (XLS File) |
|
||||||||
|
||||||||
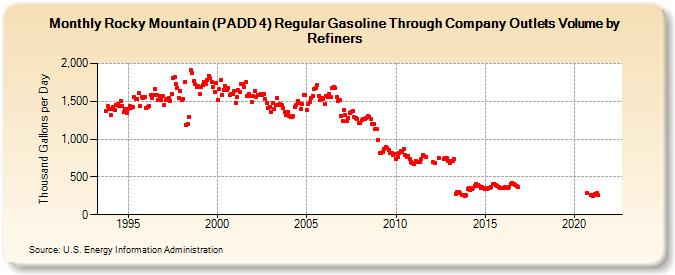
| Rocky Mountain (PADD 4) Regular Gasoline Through Company Outlets Volume by Refiners (Thousand Gallons per Day) | ||||||||
| Year | Jan | Feb | Mar | Apr | May | Jun | Jul | Aug | Sep | Oct | Nov | Dec |
|---|---|---|---|---|---|---|---|---|---|---|---|---|
| 1993 | 1,377.7 | 1,433.5 | 1,400.6 | |||||||||
| 1994 | 1,318.3 | 1,393.0 | 1,430.3 | 1,379.2 | 1,452.9 | 1,458.2 | 1,437.1 | 1,501.9 | 1,434.4 | 1,352.7 | 1,397.3 | 1,348.3 |
| 1995 | 1,403.7 | 1,436.8 | 1,407.4 | 1,420.3 | 1,551.3 | 1,528.1 | 1,524.7 | 1,603.3 | 1,443.9 | 1,550.9 | 1,546.5 | 1,556.5 |
| 1996 | 1,413.3 | 1,427.9 | 1,439.1 | 1,586.2 | 1,537.0 | 1,587.0 | 1,659.8 | 1,576.7 | 1,513.2 | 1,567.3 | 1,514.3 | 1,563.9 |
| 1997 | 1,447.9 | 1,514.9 | 1,532.5 | 1,541.0 | 1,508.0 | 1,596.9 | 1,809.9 | 1,816.1 | 1,733.8 | 1,671.2 | 1,540.0 | 1,629.5 |
| 1998 | 1,512.5 | 1,527.8 | 1,756.7 | 1,183.5 | 1,203.1 | 1,286.5 | 1,916.4 | 1,880.3 | 1,763.8 | 1,723.7 | 1,691.3 | 1,704.4 |
| 1999 | 1,600.4 | 1,693.6 | 1,716.2 | 1,761.6 | 1,724.1 | 1,783.6 | 1,838.4 | 1,804.3 | 1,758.0 | 1,689.3 | 1,627.4 | 1,736.0 |
| 2000 | 1,519.8 | 1,662.5 | 1,780.2 | 1,581.0 | 1,654.9 | 1,707.6 | 1,652.6 | 1,669.8 | 1,583.1 | 1,592.7 | 1,595.5 | 1,630.2 |
| 2001 | 1,481.7 | 1,559.5 | 1,647.5 | 1,620.9 | 1,726.1 | 1,727.0 | 1,694.1 | 1,759.8 | 1,567.7 | 1,591.1 | 1,575.0 | 1,492.4 |
| 2002 | 1,566.1 | 1,642.4 | 1,558.7 | 1,580.4 | 1,584.1 | 1,599.9 | 1,589.1 | 1,593.6 | 1,526.5 | 1,480.0 | 1,415.7 | 1,430.2 |
| 2003 | 1,354.3 | 1,479.1 | 1,397.2 | 1,454.6 | 1,544.5 | 1,456.8 | 1,462.3 | 1,452.6 | 1,415.8 | 1,360.3 | 1,317.5 | 1,360.9 |
| 2004 | 1,307.1 | 1,294.3 | 1,295.2 | 1,301.0 | 1,428.8 | 1,456.2 | 1,497.4 | 1,475.7 | 1,403.5 | 1,461.8 | 1,585.3 | 1,580.7 |
| 2005 | 1,386.3 | 1,469.6 | 1,484.1 | 1,548.5 | 1,575.7 | 1,668.2 | 1,677.2 | 1,717.7 | 1,573.8 | 1,519.1 | 1,547.1 | 1,527.6 |
| 2006 | 1,463.0 | 1,565.0 | 1,552.0 | 1,595.8 | 1,553.1 | 1,669.8 | 1,695.2 | 1,679.5 | 1,559.0 | 1,503.6 | 1,512.8 | 1,307.3 |
| 2007 | 1,232.9 | 1,378.5 | 1,313.7 | 1,240.5 | 1,283.3 | 1,349.2 | 1,364.7 | 1,369.0 | 1,287.7 | 1,284.5 | 1,263.4 | 1,212.3 |
| 2008 | 1,211.9 | 1,258.0 | 1,265.7 | 1,263.0 | 1,274.3 | 1,310.6 | 1,292.9 | 1,268.7 | 1,202.1 | 1,204.1 | 1,135.0 | 1,128.9 |
| 2009 | 990.2 | 819.4 | 810.0 | 828.3 | 870.2 | 888.9 | 885.0 | 860.3 | 821.9 | 811.5 | 784.5 | 801.5 |
| 2010 | 734.1 | 761.8 | 816.9 | 843.8 | 832.6 | 871.1 | 784.9 | 765.8 | 771.7 | 734.7 | 701.9 | 685.5 |
| 2011 | 667.5 | 711.4 | 690.9 | 697.3 | 700.2 | 735.2 | 785.5 | 774.4 | 760.1 | W | W | W |
| 2012 | W | 692.5 | 685.5 | W | W | 750.5 | W | W | 737.0 | 746.1 | 745.9 | 710.6 |
| 2013 | 684.0 | 710.7 | 714.7 | 732.9 | 277.5 | 296.5 | 302.1 | 284.3 | 266.4 | 263.7 | 253.6 | 263.9 |
| 2014 | 335.7 | 346.8 | 329.7 | 336.1 | 358.4 | 381.1 | 406.0 | 397.7 | 377.8 | 357.4 | 363.1 | 349.8 |
| 2015 | 341.4 | 339.9 | 347.6 | 351.1 | 360.4 | 399.6 | 410.2 | 390.2 | 382.9 | 371.6 | 354.7 | 355.2 |
| 2016 | 348.5 | 360.5 | 354.0 | 354.6 | 373.1 | 408.6 | 415.2 | 410.7 | 390.7 | 373.3 | 365.1 | W |
| 2017 | W | W | W | W | W | W | W | W | W | W | W | W |
| 2018 | W | W | W | W | W | W | W | W | W | W | W | W |
| 2019 | W | W | W | W | W | W | W | W | W | W | W | W |
| 2020 | W | W | W | W | W | W | W | W | 290.9 | W | W | 259.1 |
| 2021 | 253.1 | 261.8 | 277.3 | 291.2 | 255.8 | W | W | W | W | W | W | W |
| 2022 | W | W | W | |||||||||
| - = No Data Reported; -- = Not Applicable; NA = Not Available; W = Withheld to avoid disclosure of individual company data. |
| Release Date: 6/1/2022 |
| Next Release Date: TBD |