|
Download Data (XLS File) |
|
||||||||
|
||||||||
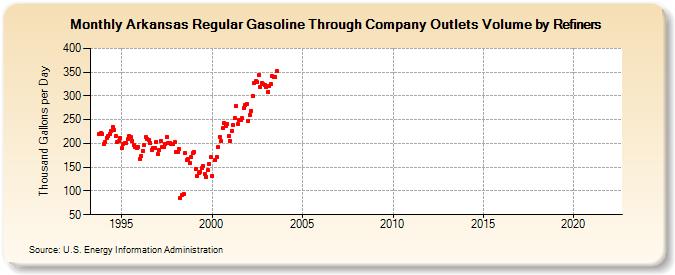
| Arkansas Regular Gasoline Through Company Outlets Volume by Refiners (Thousand Gallons per Day) | ||||||||
| Year | Jan | Feb | Mar | Apr | May | Jun | Jul | Aug | Sep | Oct | Nov | Dec |
|---|---|---|---|---|---|---|---|---|---|---|---|---|
| 1993 | 219.9 | 221.4 | 220.1 | |||||||||
| 1994 | 198.9 | 203.7 | 212.0 | 215.5 | 219.6 | 226.8 | 235.6 | 228.2 | 214.7 | 202.8 | 204.2 | 210.8 |
| 1995 | 189.5 | 199.3 | 200.0 | 200.0 | 208.6 | 214.7 | 212.9 | 206.1 | 196.8 | 193.5 | 190.6 | 192.6 |
| 1996 | 166.8 | 173.7 | 184.8 | 195.8 | 213.4 | 210.1 | 207.1 | 200.5 | 187.2 | 189.9 | 189.4 | 203.3 |
| 1997 | 177.0 | 186.0 | 205.5 | 192.6 | 193.4 | 199.3 | 213.6 | 200.7 | 200.1 | 199.5 | 199.7 | 202.9 |
| 1998 | 182.6 | 183.0 | 189.1 | 85.7 | 90.5 | 93.5 | 180.0 | 164.6 | 167.8 | 158.5 | 170.6 | 179.3 |
| 1999 | 182.8 | 146.0 | 131.2 | 137.6 | 140.8 | 148.2 | 152.9 | 135.7 | 130.2 | 143.1 | 156.2 | 171.4 |
| 2000 | 132.5 | NA | 164.8 | 171.6 | 191.6 | 214.0 | 204.5 | 232.0 | 242.3 | 237.4 | 241.6 | 216.5 |
| 2001 | 206.1 | 227.1 | 239.0 | 252.9 | 278.1 | 240.8 | 248.6 | 248.3 | 252.5 | 273.9 | 281.4 | 282.9 |
| 2002 | 248.2 | 260.7 | 269.0 | 299.3 | 328.2 | 330.4 | 328.3 | 343.0 | 319.0 | 327.0 | 324.1 | 322.4 |
| 2003 | 317.8 | 308.4 | 320.5 | 324.5 | 341.8 | 339.3 | 340.0 | 351.8 | W | W | W | W |
| 2004 | W | W | W | W | W | W | W | W | W | W | W | W |
| 2005 | W | W | W | W | W | W | W | W | W | W | W | W |
| 2006 | W | W | W | W | W | W | W | W | W | W | W | W |
| 2007 | W | W | W | W | W | W | W | W | W | W | W | W |
| 2008 | W | W | W | W | W | W | W | W | W | W | W | W |
| 2009 | W | W | W | W | W | W | W | W | W | W | W | W |
| 2010 | W | W | W | W | W | W | W | W | W | W | W | W |
| 2011 | W | W | W | W | W | W | W | W | W | - | - | - |
| 2012 | - | - | - | - | - | - | - | - | - | - | - | - |
| 2013 | - | - | - | - | - | - | - | - | - | - | - | - |
| 2014 | - | - | W | W | W | W | W | W | W | W | W | W |
| 2015 | W | W | W | W | W | W | W | W | W | W | W | W |
| 2016 | W | W | W | W | W | W | W | W | W | W | W | - |
| 2017 | - | - | - | - | - | - | - | - | - | - | - | - |
| 2018 | - | - | - | - | - | - | - | - | - | - | - | - |
| 2019 | - | - | - | - | - | - | - | - | - | - | - | - |
| 2020 | - | - | - | - | - | - | - | - | - | - | - | - |
| 2021 | - | - | - | - | - | - | - | - | - | - | - | - |
| 2022 | - | - | - | |||||||||
| - = No Data Reported; -- = Not Applicable; NA = Not Available; W = Withheld to avoid disclosure of individual company data. |
| Release Date: 6/1/2022 |
| Next Release Date: TBD |