|
Download Data (XLS File) |
|
||||||||
|
||||||||
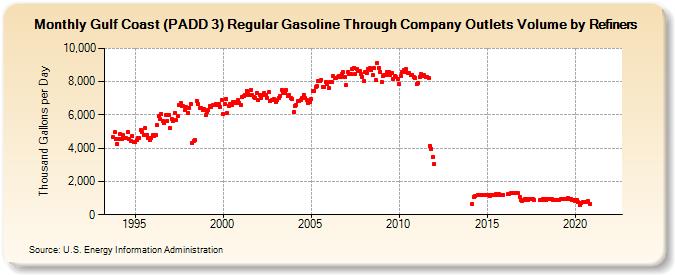
| Gulf Coast (PADD 3) Regular Gasoline Through Company Outlets Volume by Refiners (Thousand Gallons per Day) | ||||||||
| Year | Jan | Feb | Mar | Apr | May | Jun | Jul | Aug | Sep | Oct | Nov | Dec |
|---|---|---|---|---|---|---|---|---|---|---|---|---|
| 1993 | 4,650.2 | 4,944.2 | 4,534.8 | |||||||||
| 1994 | 4,241.9 | 4,550.1 | 4,854.4 | 4,536.7 | 4,773.2 | 4,610.9 | 4,595.4 | 4,963.8 | 4,545.7 | 4,427.7 | 4,732.5 | 4,369.8 |
| 1995 | 4,388.7 | 4,469.7 | 4,612.7 | 4,610.8 | 5,100.8 | 4,970.8 | 4,813.6 | 5,218.0 | 4,819.2 | 4,598.1 | 4,499.6 | 4,596.6 |
| 1996 | 4,805.6 | 4,712.4 | 4,795.2 | 5,374.8 | 5,917.3 | 5,741.6 | 6,072.5 | 5,656.2 | 5,512.8 | 5,987.2 | 5,623.2 | 5,975.7 |
| 1997 | 5,197.3 | 5,759.4 | 5,639.2 | 6,122.7 | 5,684.4 | 5,936.2 | 6,609.9 | 6,709.1 | 6,555.5 | 6,507.0 | 6,271.8 | 6,460.9 |
| 1998 | 6,118.8 | 6,418.9 | 6,669.1 | 4,282.2 | 4,443.0 | 4,464.1 | 6,837.3 | 6,641.3 | 6,405.3 | 6,401.0 | 6,275.8 | 6,351.7 |
| 1999 | 5,984.9 | 6,185.9 | 6,272.3 | 6,554.3 | 6,464.0 | 6,566.9 | 6,614.8 | 6,683.6 | 6,578.0 | 6,632.7 | 6,505.4 | 6,921.6 |
| 2000 | 6,061.1 | 6,646.7 | 6,979.8 | 6,098.3 | 6,548.5 | 6,672.6 | 6,623.2 | 6,765.1 | 6,755.0 | 6,718.6 | 6,867.2 | 6,741.1 |
| 2001 | 6,603.2 | 7,083.6 | 7,113.6 | 7,199.3 | 7,454.1 | 7,259.7 | 7,174.6 | 7,523.9 | 7,197.3 | 7,088.7 | 7,040.2 | 7,324.0 |
| 2002 | 6,880.5 | 7,203.2 | 6,990.2 | 7,213.2 | 7,338.5 | 7,216.2 | 7,013.2 | 7,362.5 | 6,831.0 | 6,922.1 | 6,908.6 | 6,933.1 |
| 2003 | 6,760.0 | 6,895.8 | 7,016.2 | 7,135.1 | 7,513.7 | 7,328.8 | 7,297.0 | 7,499.7 | 7,126.1 | 7,221.4 | 6,990.5 | 6,961.9 |
| 2004 | 6,164.8 | 6,543.5 | 6,621.5 | 6,812.7 | 6,838.7 | 6,875.0 | 7,019.1 | 7,216.3 | 6,999.2 | 6,891.1 | 6,701.6 | 6,778.0 |
| 2005 | 6,939.7 | 7,424.3 | 7,463.0 | 7,680.7 | 7,712.5 | 8,056.4 | 8,058.5 | 8,128.0 | 7,679.8 | 7,683.0 | 8,003.1 | 7,855.3 |
| 2006 | 7,629.8 | 7,960.6 | 7,962.1 | 8,312.1 | 8,223.9 | 8,235.6 | 8,293.6 | 8,363.5 | 8,292.2 | 8,484.8 | 8,560.7 | 8,290.1 |
| 2007 | 7,782.8 | 8,554.8 | 8,452.1 | 8,478.1 | 8,748.1 | 8,845.6 | 8,459.9 | 8,788.6 | 8,622.5 | 8,652.4 | 8,459.1 | 8,269.1 |
| 2008 | 8,024.6 | 8,565.0 | 8,515.3 | 8,738.6 | 8,801.6 | 8,705.6 | 8,412.3 | 8,794.1 | 8,080.6 | 9,149.5 | 8,839.6 | 8,566.2 |
| 2009 | 7,971.0 | 8,317.8 | 8,372.7 | 8,396.7 | 8,560.3 | 8,605.9 | 8,409.1 | 8,511.9 | 8,184.5 | 8,328.3 | 8,262.3 | 8,153.7 |
| 2010 | 7,837.8 | 8,312.8 | 8,577.9 | 8,681.9 | 8,568.8 | 8,760.7 | 8,507.7 | 8,539.8 | 8,413.8 | 8,429.7 | 8,272.5 | 8,232.7 |
| 2011 | 7,842.8 | 7,930.3 | 8,283.3 | 8,455.4 | 8,350.6 | 8,375.4 | 8,268.7 | 8,296.8 | 8,207.2 | 4,152.5 | 3,959.7 | 3,450.8 |
| 2012 | 3,037.4 | W | W | W | W | W | W | W | W | W | W | W |
| 2013 | W | W | W | W | W | W | W | W | W | W | W | W |
| 2014 | W | W | 642.9 | 1,090.2 | 1,102.8 | NA | 1,157.5 | 1,211.8 | 1,199.2 | 1,197.7 | NA | 1,173.7 |
| 2015 | 1,181.5 | 1,171.0 | 1,153.9 | 1,181.2 | 1,180.2 | 1,207.5 | 1,226.2 | 1,209.5 | 1,223.8 | 1,187.6 | 1,155.8 | 1,214.7 |
| 2016 | NA | NA | 1,228.6 | 1,258.5 | 1,276.7 | 1,279.8 | 1,289.6 | 1,309.4 | 1,279.1 | 1,279.6 | 1,050.9 | 896.5 |
| 2017 | 848.2 | 889.1 | 952.2 | 917.5 | 912.0 | 941.7 | 921.9 | 934.7 | 900.0 | NA | NA | W |
| 2018 | 868.6 | 898.4 | 955.8 | 939.7 | 886.3 | 956.4 | 933.2 | 971.0 | 919.6 | 911.1 | 885.7 | 874.2 |
| 2019 | 861.9 | 882.1 | 950.4 | 940.2 | 946.4 | 965.7 | 970.0 | 1,034.6 | 920.0 | 946.3 | 903.4 | 856.3 |
| 2020 | 831.2 | 860.2 | 745.4 | 555.1 | 677.8 | 774.3 | 781.0 | 786.9 | W | 801.4 | 672.4 | W |
| 2021 | W | W | W | W | W | W | W | W | W | W | W | W |
| 2022 | W | W | W | |||||||||
| - = No Data Reported; -- = Not Applicable; NA = Not Available; W = Withheld to avoid disclosure of individual company data. |
| Release Date: 6/1/2022 |
| Next Release Date: TBD |