|
Download Data (XLS File) |
|
||||||||
|
||||||||
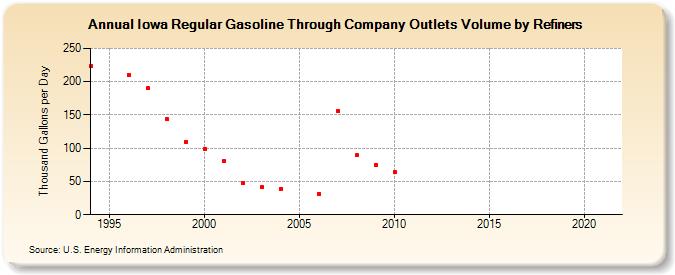
| Iowa Regular Gasoline Through Company Outlets Volume by Refiners (Thousand Gallons per Day) | ||||||||
| Decade | Year-0 | Year-1 | Year-2 | Year-3 | Year-4 | Year-5 | Year-6 | Year-7 | Year-8 | Year-9 |
|---|---|---|---|---|---|---|---|---|---|---|
| 1990's | 222.9 | W | 210.4 | 189.8 | 143.3 | 109.9 | ||||
| 2000's | 99.3 | 81.4 | 48.3 | 41.6 | 39.1 | W | 31.6 | 156.1 | 89.2 | 75.0 |
| 2010's | 64.3 | W | - | - | - | - | - | - | - | - |
| 2020's | - |
| - = No Data Reported; -- = Not Applicable; NA = Not Available; W = Withheld to avoid disclosure of individual company data. |
| Release Date: 6/1/2022 |
| Next Release Date: TBD |