|
Download Data (XLS File) |
|
||||||||
|
||||||||
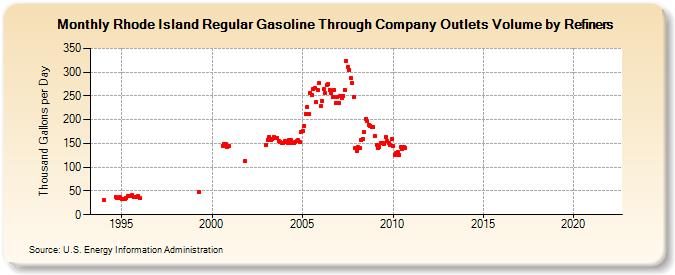
| Rhode Island Regular Gasoline Through Company Outlets Volume by Refiners (Thousand Gallons per Day) | ||||||||
| Year | Jan | Feb | Mar | Apr | May | Jun | Jul | Aug | Sep | Oct | Nov | Dec |
|---|---|---|---|---|---|---|---|---|---|---|---|---|
| 1993 | W | W | W | |||||||||
| 1994 | 30.6 | W | W | W | W | W | W | W | 37.0 | 36.0 | 34.5 | 36.3 |
| 1995 | 32.5 | 32.6 | 32.6 | 35.4 | 38.6 | 40.3 | 38.9 | 40.6 | 37.7 | 37.5 | 37.8 | 39.1 |
| 1996 | 35.2 | W | W | W | W | W | W | W | W | W | W | W |
| 1997 | W | W | W | W | W | W | W | W | W | W | W | W |
| 1998 | W | W | W | W | W | W | W | W | W | W | W | W |
| 1999 | W | W | W | 48.1 | W | W | W | W | W | W | W | W |
| 2000 | W | W | W | W | W | W | W | 145.6 | 149.4 | 147.9 | 143.0 | 143.7 |
| 2001 | W | W | W | W | W | W | W | W | W | W | 113.2 | W |
| 2002 | W | W | W | W | W | W | W | W | W | W | W | W |
| 2003 | 147.1 | 156.5 | 163.3 | 157.4 | 160.3 | 164.2 | 162.4 | 161.1 | 154.2 | 153.5 | 151.2 | 150.3 |
| 2004 | 155.4 | 153.5 | 151.9 | 157.0 | 156.9 | 150.6 | 150.8 | 153.3 | 155.6 | 157.3 | 152.1 | 173.6 |
| 2005 | 177.0 | 187.5 | 212.0 | 227.2 | 210.9 | 256.2 | 252.0 | 263.7 | 265.6 | 236.3 | 261.4 | 277.5 |
| 2006 | 228.6 | 239.4 | 264.1 | 256.6 | 272.7 | 274.5 | 262.7 | 256.6 | 247.1 | 262.5 | 234.5 | 248.0 |
| 2007 | 234.2 | 250.5 | 244.8 | 250.5 | 263.2 | 323.9 | 310.9 | 305.5 | 288.5 | 276.9 | 247.3 | 140.2 |
| 2008 | 134.6 | 141.8 | 139.8 | 156.4 | 160.3 | 173.5 | 202.4 | 196.6 | 189.6 | 187.5 | 184.1 | 185.4 |
| 2009 | 165.5 | 146.7 | 140.8 | 143.3 | 150.9 | 151.4 | 148.1 | 163.1 | 155.2 | 150.4 | 146.8 | 158.5 |
| 2010 | 145.2 | 126.6 | 129.5 | 131.1 | 126.7 | 141.9 | 138.2 | 142.1 | 141.4 | W | W | W |
| 2011 | W | W | W | W | W | W | W | W | W | W | W | W |
| 2012 | W | W | W | W | W | W | W | W | W | W | W | W |
| 2013 | W | W | W | W | W | W | W | W | W | NA | NA | - |
| 2014 | - | - | - | - | - | - | - | - | - | W | W | W |
| 2015 | W | W | W | W | W | W | W | W | W | W | W | W |
| 2016 | W | W | W | W | W | W | W | W | W | W | W | W |
| 2017 | W | W | W | W | W | W | W | W | W | W | W | W |
| 2018 | W | W | W | W | W | W | W | W | W | W | W | W |
| 2019 | W | W | W | W | W | W | W | W | W | W | W | W |
| 2020 | W | W | W | W | W | W | W | W | W | W | W | W |
| 2021 | W | W | W | W | W | - | - | - | - | - | - | - |
| 2022 | - | - | - | |||||||||
| - = No Data Reported; -- = Not Applicable; NA = Not Available; W = Withheld to avoid disclosure of individual company data. |
| Release Date: 6/1/2022 |
| Next Release Date: TBD |