|
Download Data (XLS File) |
|
||||||||
|
||||||||
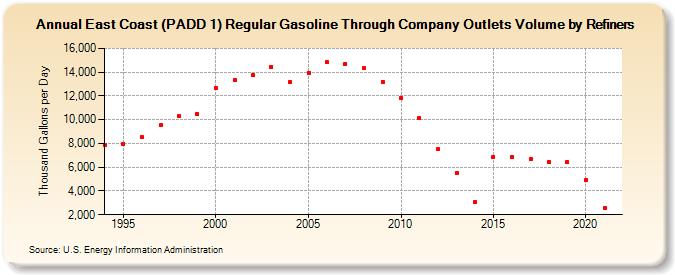
| East Coast (PADD 1) Regular Gasoline Through Company Outlets Volume by Refiners (Thousand Gallons per Day) | ||||||||
| Decade | Year-0 | Year-1 | Year-2 | Year-3 | Year-4 | Year-5 | Year-6 | Year-7 | Year-8 | Year-9 |
|---|---|---|---|---|---|---|---|---|---|---|
| 1990's | 7,860.0 | 7,961.7 | 8,525.4 | 9,515.9 | 10,275.1 | 10,459.0 | ||||
| 2000's | 12,630.9 | 13,311.9 | 13,759.7 | 14,420.1 | 13,184.4 | 13,967.2 | 14,817.2 | 14,717.9 | 14,323.8 | 13,203.5 |
| 2010's | 11,829.5 | 10,167.9 | 7,504.7 | 5,492.3 | 3,055.1 | 6,896.3 | 6,854.4 | 6,663.9 | 6,400.4 | 6,405.3 |
| 2020's | 4,905.0 |
| - = No Data Reported; -- = Not Applicable; NA = Not Available; W = Withheld to avoid disclosure of individual company data. |
| Release Date: 6/1/2022 |
| Next Release Date: TBD |