|
Download Data (XLS File) |
|
||||||||
|
||||||||
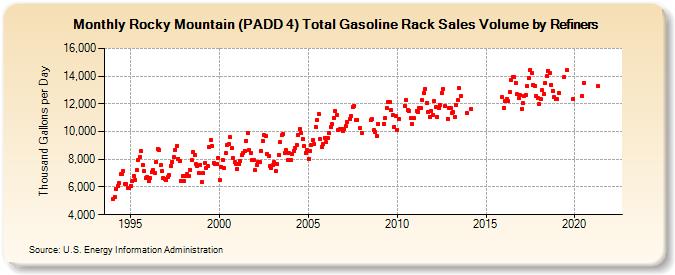
| Rocky Mountain (PADD 4) Total Gasoline Rack Sales Volume by Refiners (Thousand Gallons per Day) | ||||||||
| Year | Jan | Feb | Mar | Apr | May | Jun | Jul | Aug | Sep | Oct | Nov | Dec |
|---|---|---|---|---|---|---|---|---|---|---|---|---|
| 1994 | 5,136.9 | 5,291.6 | 5,878.5 | 6,043.8 | 6,276.0 | 6,912.4 | 6,943.6 | 7,159.7 | 6,209.1 | 6,224.7 | 5,949.6 | 5,962.0 |
| 1995 | 6,095.5 | 6,408.1 | 6,778.0 | 6,502.6 | 7,227.3 | 7,958.9 | 8,162.3 | 8,571.2 | 7,599.1 | 7,134.5 | 6,663.0 | 6,707.1 |
| 1996 | 6,407.9 | 6,647.1 | 7,059.3 | 7,211.8 | 7,036.8 | 7,822.1 | 8,730.1 | 8,677.2 | 7,559.8 | 7,142.5 | 6,674.8 | 6,573.7 |
| 1997 | 6,481.7 | 6,703.1 | 6,865.5 | 7,479.4 | 7,838.1 | 8,153.7 | 8,691.8 | 8,969.1 | 8,048.3 | 7,868.1 | 6,424.0 | 6,791.4 |
| 1998 | 6,409.7 | 6,758.7 | 6,922.5 | 6,826.5 | 7,210.7 | 7,941.3 | 8,524.5 | 8,334.4 | 7,642.9 | 7,531.0 | 6,973.7 | 7,619.0 |
| 1999 | 6,349.6 | 7,001.7 | 7,733.5 | 7,390.1 | 7,483.2 | 8,858.3 | 9,414.6 | 8,981.7 | 7,731.5 | 7,667.8 | 7,690.1 | 8,101.5 |
| 2000 | 6,472.9 | 7,445.2 | 7,978.7 | 7,357.3 | 8,447.9 | 9,049.0 | 9,092.7 | 9,600.8 | 8,791.4 | 8,108.7 | 7,779.8 | 7,643.1 |
| 2001 | 7,328.0 | 7,669.8 | 7,910.4 | 8,293.5 | 8,477.5 | 8,616.1 | 9,336.3 | 9,903.9 | 8,640.5 | 8,457.3 | 7,981.3 | 7,922.0 |
| 2002 | 7,203.9 | 7,617.4 | 7,794.3 | 7,801.7 | 8,620.1 | 9,340.4 | 9,762.3 | 9,657.8 | 8,368.4 | 8,241.2 | 7,505.2 | 7,404.6 |
| 2003 | 7,567.9 | 7,771.9 | 7,133.9 | 7,663.7 | 8,331.7 | 9,227.0 | 9,727.2 | 9,824.4 | 8,486.6 | 8,633.3 | 7,940.7 | 8,425.5 |
| 2004 | 7,927.8 | 8,398.5 | 8,606.4 | 8,840.0 | 9,040.8 | 9,766.5 | 10,179.2 | 9,882.2 | 9,474.0 | 8,942.8 | 8,453.1 | 8,669.0 |
| 2005 | 8,015.4 | 8,597.8 | 9,030.2 | 9,382.7 | 9,109.7 | 10,292.9 | 10,848.9 | 11,251.1 | 9,457.1 | 8,916.4 | 9,066.7 | 9,557.8 |
| 2006 | 9,215.0 | 9,539.9 | 9,922.7 | 10,354.2 | 10,539.8 | 11,008.0 | 11,516.4 | 11,224.6 | 10,097.8 | 10,148.8 | 10,181.6 | 10,021.5 |
| 2007 | 10,157.1 | 10,402.8 | 10,690.2 | W | 10,908.8 | 11,112.9 | 11,763.3 | 11,845.6 | 10,809.3 | 10,864.5 | W | 10,231.4 |
| 2008 | 9,901.8 | W | W | W | W | W | 10,813.5 | 10,880.2 | 10,086.1 | 9,935.6 | 9,687.5 | 10,562.9 |
| 2009 | W | W | W | 10,550.7 | 11,011.3 | 11,710.1 | 12,133.4 | 12,098.7 | 11,539.8 | 11,173.0 | 10,330.2 | 11,144.5 |
| 2010 | 10,119.5 | 10,881.4 | W | W | W | 11,854.1 | 12,298.3 | 11,557.7 | 11,493.9 | 10,975.8 | 10,530.6 | 10,949.5 |
| 2011 | W | 11,513.1 | 11,438.1 | 11,695.0 | 11,670.9 | 12,262.7 | 12,781.5 | 13,105.8 | 12,084.5 | 11,399.5 | 11,070.2 | 11,498.9 |
| 2012 | 11,205.1 | 12,210.0 | 11,767.3 | 11,074.1 | 11,705.2 | 11,934.5 | 12,770.0 | 13,059.6 | 11,814.5 | W | 10,939.4 | 11,690.4 |
| 2013 | 11,691.8 | 11,360.7 | 11,397.3 | 11,050.0 | 11,889.4 | 12,266.6 | 13,114.4 | 12,547.1 | W | W | W | 11,369.9 |
| 2014 | W | W | 11,631.6 | W | W | W | W | W | W | W | W | W |
| 2015 | W | W | W | W | W | W | W | W | W | W | W | 12,460.1 |
| 2016 | 11,730.6 | 12,183.7 | 12,333.8 | 12,207.6 | 12,829.6 | 13,693.8 | 13,951.6 | 13,921.1 | 13,535.8 | 12,690.5 | 12,399.9 | 12,608.7 |
| 2017 | 11,661.6 | 12,052.7 | 12,590.9 | 12,651.9 | 13,274.5 | 13,878.7 | 14,473.6 | 14,244.6 | 13,343.9 | 13,274.5 | 12,578.9 | 12,436.8 |
| 2018 | 11,975.4 | 12,319.3 | 12,964.1 | 12,698.0 | 13,478.2 | 14,001.8 | 14,396.0 | 14,207.3 | 13,391.1 | 12,959.5 | 12,468.9 | 12,326.8 |
| 2019 | 12,329.5 | 12,810.8 | W | W | W | 13,936.7 | W | 14,428.7 | W | W | W | 12,354.7 |
| 2020 | W | W | W | W | W | 12,576.5 | 13,527.5 | W | W | W | W | W |
| 2021 | W | W | W | W | 13,251.6 | W | W | W | W | W | W | W |
| 2022 | W | W | W | |||||||||
| - = No Data Reported; -- = Not Applicable; NA = Not Available; W = Withheld to avoid disclosure of individual company data. |
| Release Date: 6/1/2022 |
| Next Release Date: TBD |