|
Download Data (XLS File) |
|
||||||||
|
||||||||
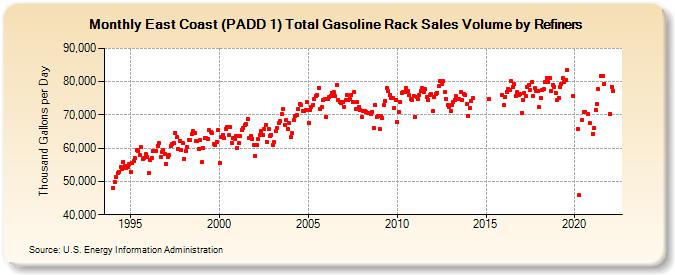
| East Coast (PADD 1) Total Gasoline Rack Sales Volume by Refiners (Thousand Gallons per Day) | ||||||||
| Year | Jan | Feb | Mar | Apr | May | Jun | Jul | Aug | Sep | Oct | Nov | Dec |
|---|---|---|---|---|---|---|---|---|---|---|---|---|
| 1994 | 48,137.8 | 49,831.8 | 51,386.9 | 52,554.3 | 52,965.6 | 54,350.2 | 53,734.2 | 55,852.7 | 54,646.3 | 54,081.8 | 54,280.3 | 55,315.6 |
| 1995 | 52,782.0 | 55,414.7 | 56,262.0 | 56,930.3 | 59,378.1 | 59,168.3 | 57,925.1 | 60,313.3 | 56,651.5 | 56,969.3 | 58,121.0 | 57,294.8 |
| 1996 | 52,444.4 | 56,543.6 | 57,084.0 | 59,279.8 | 59,146.6 | 59,266.4 | 60,726.7 | 61,487.1 | 57,303.9 | 58,803.3 | 59,395.9 | 58,215.1 |
| 1997 | 55,392.0 | 57,494.8 | 57,916.8 | 60,575.5 | 61,189.5 | 61,521.2 | 64,714.9 | 63,273.4 | 59,889.1 | 62,275.7 | 59,307.5 | 61,485.4 |
| 1998 | 56,855.5 | 59,038.0 | 60,506.3 | 62,405.6 | 62,439.2 | 64,198.1 | 65,074.0 | 64,583.6 | 62,176.3 | 62,184.8 | 59,901.6 | 62,326.9 |
| 1999 | 55,747.1 | 60,060.2 | 62,997.5 | 62,996.9 | 62,693.1 | 65,347.5 | 64,990.9 | 64,603.4 | 61,368.7 | 61,005.3 | 61,976.8 | 65,419.2 |
| 2000 | 55,626.8 | 63,395.6 | 64,112.1 | 63,004.8 | 65,822.4 | 66,398.4 | 63,873.4 | 66,372.1 | 61,607.7 | 63,112.1 | 62,730.7 | 63,697.3 |
| 2001 | 60,087.7 | 61,614.8 | 63,546.2 | 65,416.6 | 66,035.0 | 67,119.1 | 67,134.4 | 68,821.2 | 62,936.7 | 63,668.8 | 62,780.6 | 60,966.3 |
| 2002 | 57,733.2 | 60,979.0 | 62,663.1 | 63,930.5 | 65,060.8 | 63,837.7 | 65,846.6 | 67,042.5 | 61,754.7 | 65,769.0 | 63,803.6 | 64,069.7 |
| 2003 | 60,923.6 | 61,806.5 | 65,096.3 | 66,200.6 | 67,432.2 | 68,080.3 | 70,229.3 | 71,729.2 | 67,063.3 | 68,433.5 | 65,710.6 | 67,582.7 |
| 2004 | 63,262.2 | 64,427.5 | 68,470.4 | 69,565.9 | 69,984.7 | 71,752.2 | 73,347.0 | 72,987.3 | 71,091.7 | 71,314.7 | 71,607.7 | 73,857.9 |
| 2005 | 67,565.0 | 71,544.5 | 72,513.6 | 73,104.4 | 74,706.1 | 75,696.8 | 76,056.0 | 78,237.4 | 71,740.0 | 72,363.0 | 74,367.9 | 74,760.4 |
| 2006 | 69,426.1 | 74,755.3 | 75,247.7 | 75,703.4 | 76,715.5 | 76,776.7 | 75,547.8 | 79,091.6 | 74,553.9 | 74,005.7 | 73,573.0 | 73,802.6 |
| 2007 | 72,448.8 | 74,409.5 | 75,952.4 | 74,445.5 | 74,824.5 | 75,858.4 | 73,766.6 | 76,906.5 | 71,662.1 | 73,782.0 | 72,281.6 | 71,354.5 |
| 2008 | 69,358.3 | 71,207.0 | 71,282.1 | 70,976.7 | 70,703.5 | 70,662.5 | 70,298.0 | 71,020.4 | 66,169.4 | 73,071.2 | 69,515.2 | 69,639.8 |
| 2009 | 65,696.5 | 69,632.9 | 68,947.9 | 72,870.4 | 74,184.6 | 78,020.1 | 77,146.4 | 76,107.2 | 74,961.9 | 75,068.1 | 71,949.3 | 74,449.6 |
| 2010 | 67,981.6 | 70,782.0 | 73,886.0 | 76,499.1 | 76,851.2 | 76,982.2 | 78,157.2 | 77,237.2 | 75,850.8 | 74,770.3 | 74,579.5 | 75,780.5 |
| 2011 | 69,328.0 | 75,430.8 | 74,752.0 | 75,981.1 | 77,148.5 | 78,030.2 | 76,785.8 | 77,656.2 | 75,356.2 | 74,556.8 | 75,909.9 | 76,183.5 |
| 2012 | 71,134.1 | 75,358.4 | 76,414.0 | 76,688.5 | 78,592.3 | 80,222.0 | 79,195.2 | 80,115.7 | 76,886.2 | 74,922.4 | 72,966.3 | 72,492.3 |
| 2013 | 71,150.0 | 73,057.7 | 74,033.9 | 74,492.4 | 75,566.4 | 74,833.7 | 74,678.4 | 76,739.9 | 74,400.4 | 76,427.2 | 75,945.5 | 73,289.9 |
| 2014 | 69,679.4 | 72,217.6 | 74,154.9 | 75,059.6 | W | W | W | W | W | W | W | W |
| 2015 | W | W | 74,753.4 | W | W | W | W | W | W | W | W | 76,020.6 |
| 2016 | 72,875.8 | 75,522.5 | 76,828.0 | 77,763.9 | 77,502.2 | 80,185.5 | 78,538.3 | 79,220.0 | 75,825.4 | 76,782.0 | 75,854.8 | 76,282.1 |
| 2017 | 70,698.0 | 74,426.7 | 76,619.5 | 75,679.4 | 78,249.2 | 78,907.8 | 77,515.7 | 79,963.7 | 75,751.3 | 77,943.8 | 77,294.7 | 77,204.0 |
| 2018 | 72,331.4 | 75,048.6 | 77,514.9 | 77,693.1 | 79,883.8 | 81,121.1 | 79,873.7 | 81,061.5 | 77,220.0 | 79,071.5 | 78,465.1 | 76,578.0 |
| 2019 | 74,350.9 | 75,185.5 | 78,455.6 | 79,371.3 | 81,002.3 | 79,800.5 | 80,527.2 | 83,469.4 | W | W | W | 75,814.4 |
| 2020 | W | W | 65,692.9 | 45,891.6 | W | 68,572.2 | 70,768.0 | 70,995.0 | W | 70,172.1 | 67,434.5 | W |
| 2021 | 64,411.0 | 65,981.5 | 71,550.2 | 73,407.3 | 77,669.0 | W | 81,734.1 | 81,827.9 | 79,318.6 | W | W | W |
| 2022 | 70,345.0 | 78,472.4 | 77,089.2 | |||||||||
| - = No Data Reported; -- = Not Applicable; NA = Not Available; W = Withheld to avoid disclosure of individual company data. |
| Release Date: 6/1/2022 |
| Next Release Date: TBD |