|
Download Data (XLS File) |
|
||||||||
|
||||||||
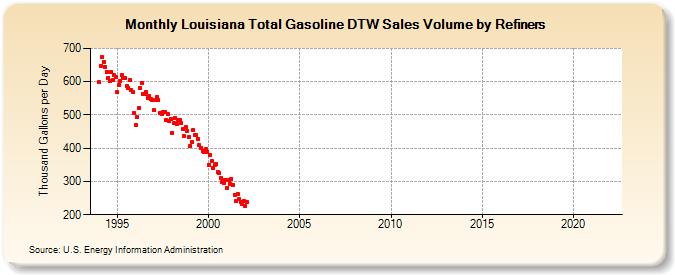
| Louisiana Total Gasoline DTW Sales Volume by Refiners (Thousand Gallons per Day) | ||||||||
| Year | Jan | Feb | Mar | Apr | May | Jun | Jul | Aug | Sep | Oct | Nov | Dec |
|---|---|---|---|---|---|---|---|---|---|---|---|---|
| 1994 | 598.3 | 647.7 | 673.9 | 660.2 | 645.5 | 627.7 | 612.2 | 600.8 | 629.4 | 604.4 | 619.1 | 613.5 |
| 1995 | 567.8 | 590.4 | 603.3 | 620.3 | 610.3 | 610.9 | 586.4 | 582.3 | 603.6 | 575.8 | 569.3 | 505.5 |
| 1996 | 469.8 | 492.7 | 521.7 | 580.9 | 595.8 | 562.3 | 562.2 | 567.6 | 552.0 | 555.8 | 547.1 | 545.3 |
| 1997 | 513.5 | 543.9 | 554.2 | 544.2 | 505.7 | 503.5 | 509.4 | 510.0 | 484.8 | 501.4 | 480.7 | 488.4 |
| 1998 | 445.9 | 476.0 | 490.5 | 473.4 | 483.8 | 483.4 | 476.1 | 456.2 | 435.8 | 462.8 | 451.1 | 432.5 |
| 1999 | 407.8 | 418.1 | 454.5 | 440.2 | 438.5 | 428.8 | 409.3 | 401.8 | 390.3 | 389.0 | 398.5 | 389.0 |
| 2000 | 350.1 | 378.1 | 361.7 | 340.7 | 348.5 | 353.9 | 329.0 | 324.1 | 310.6 | 298.9 | 294.2 | 305.2 |
| 2001 | 281.8 | 304.5 | 293.3 | 308.6 | 288.8 | 260.3 | 240.1 | 263.0 | 246.4 | 236.8 | 233.2 | 241.6 |
| 2002 | 227.4 | 236.8 | W | W | W | W | W | W | W | W | W | W |
| 2003 | W | W | W | W | W | W | W | W | W | W | W | W |
| 2004 | W | W | W | W | W | W | W | W | W | W | W | W |
| 2005 | W | W | W | W | W | W | W | W | W | W | W | W |
| 2006 | W | W | W | W | W | W | W | W | W | W | W | W |
| 2007 | W | W | W | W | W | W | W | W | W | W | W | W |
| 2008 | W | W | W | - | W | - | W | W | W | W | - | - |
| 2009 | W | - | - | W | - | W | - | - | W | - | - | - |
| 2010 | - | - | W | - | W | W | - | - | - | W | W | - |
| 2011 | W | W | W | W | W | W | W | W | W | W | W | W |
| 2012 | W | W | W | W | W | W | W | W | W | W | W | W |
| 2013 | W | W | W | W | W | W | W | W | W | W | W | W |
| 2014 | W | W | - | W | W | W | W | W | W | W | W | W |
| 2015 | - | W | W | W | - | - | - | - | - | - | - | - |
| 2016 | - | - | - | - | - | - | - | - | - | - | - | - |
| 2017 | - | - | - | - | - | - | - | - | - | - | - | - |
| 2018 | - | - | - | - | - | - | - | - | - | - | - | - |
| 2019 | - | - | - | - | - | - | - | - | - | - | - | - |
| 2020 | - | - | - | - | - | - | - | - | - | - | - | - |
| 2021 | - | - | - | - | - | - | - | - | - | - | - | - |
| 2022 | - | - | - | |||||||||
| - = No Data Reported; -- = Not Applicable; NA = Not Available; W = Withheld to avoid disclosure of individual company data. |
| Release Date: 6/1/2022 |
| Next Release Date: TBD |