|
Download Data (XLS File) |
|
||||||||
|
||||||||
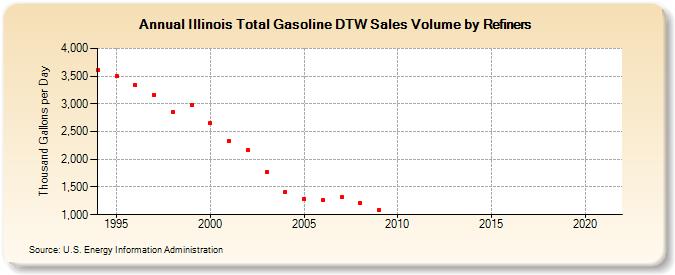
| Illinois Total Gasoline DTW Sales Volume by Refiners (Thousand Gallons per Day) | ||||||||
| Decade | Year-0 | Year-1 | Year-2 | Year-3 | Year-4 | Year-5 | Year-6 | Year-7 | Year-8 | Year-9 |
|---|---|---|---|---|---|---|---|---|---|---|
| 1990's | 3,608.0 | 3,498.6 | 3,335.3 | 3,168.3 | 2,853.4 | 2,987.8 | ||||
| 2000's | 2,645.3 | 2,331.0 | 2,162.4 | 1,769.0 | 1,409.8 | 1,289.8 | 1,261.4 | 1,313.2 | 1,207.7 | 1,078.1 |
| 2010's | W | W | W | W | W | - | - | - | - | - |
| 2020's | - |
| - = No Data Reported; -- = Not Applicable; NA = Not Available; W = Withheld to avoid disclosure of individual company data. |
| Release Date: 6/1/2022 |
| Next Release Date: TBD |