|
Download Data (XLS File) |
|
||||||||
|
||||||||
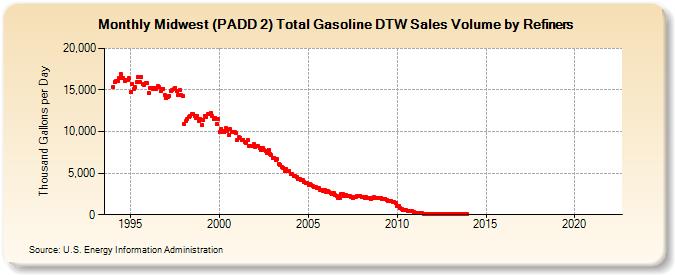
| Midwest (PADD 2) Total Gasoline DTW Sales Volume by Refiners (Thousand Gallons per Day) | ||||||||
| Year | Jan | Feb | Mar | Apr | May | Jun | Jul | Aug | Sep | Oct | Nov | Dec |
|---|---|---|---|---|---|---|---|---|---|---|---|---|
| 1994 | 15,362.8 | 15,972.0 | 16,044.3 | 16,137.5 | 16,409.3 | 16,926.7 | 16,482.6 | 16,433.7 | 16,112.2 | 16,164.6 | 16,201.6 | 16,422.7 |
| 1995 | 14,730.1 | 15,717.3 | 15,157.0 | 15,323.7 | 15,914.5 | 16,526.7 | 15,965.6 | 16,599.3 | 15,772.2 | 15,586.8 | 15,868.8 | 15,806.2 |
| 1996 | 14,670.6 | 15,244.7 | 15,188.2 | 15,066.1 | 15,202.1 | 15,116.9 | 15,436.0 | 15,322.2 | 14,856.5 | 15,153.6 | 15,151.4 | 14,350.0 |
| 1997 | 13,979.4 | 14,115.9 | 14,311.0 | 14,824.3 | 15,000.7 | 15,085.7 | 15,292.3 | 14,895.9 | 14,378.0 | 14,986.1 | 14,430.3 | 14,313.2 |
| 1998 | 10,920.9 | 11,209.1 | 11,479.0 | 11,690.9 | 11,870.3 | 12,079.6 | 12,082.0 | 11,856.1 | 11,610.8 | 11,884.8 | 11,271.2 | 11,535.4 |
| 1999 | 10,761.2 | 11,377.0 | 11,899.7 | 11,785.9 | 12,057.0 | 12,163.4 | 12,246.9 | 11,858.3 | 11,488.4 | 11,619.1 | 10,926.3 | 11,525.6 |
| 2000 | 9,920.4 | 10,331.6 | 10,031.0 | 9,953.9 | 10,367.1 | 10,112.7 | 9,535.7 | 10,288.9 | 10,001.5 | 9,974.4 | 9,953.2 | 9,883.5 |
| 2001 | 9,016.3 | 9,313.1 | 9,230.7 | 9,030.5 | 9,024.9 | 8,766.1 | 8,588.9 | 9,011.4 | 8,282.2 | 8,266.9 | 8,282.7 | 8,466.8 |
| 2002 | 8,119.0 | 8,224.1 | 8,213.3 | 8,036.9 | 7,829.7 | 7,977.7 | 7,726.5 | 7,713.1 | 7,368.7 | 7,816.7 | 7,345.0 | 7,156.5 |
| 2003 | 6,866.0 | 6,813.5 | 6,524.4 | 6,641.5 | 6,137.9 | 5,998.6 | 5,734.5 | 5,666.3 | 5,243.5 | 5,479.1 | 5,200.1 | 5,263.4 |
| 2004 | 4,931.1 | 4,907.8 | 4,652.0 | 4,658.8 | 4,525.6 | 4,294.9 | 4,278.1 | 4,195.8 | 4,122.2 | 3,970.5 | 3,822.5 | 3,849.7 |
| 2005 | 3,557.4 | 3,663.8 | 3,612.3 | 3,407.1 | 3,325.2 | 3,347.7 | 3,160.6 | 3,201.6 | 2,982.9 | 2,935.1 | 2,869.7 | 2,975.1 |
| 2006 | 2,726.1 | 2,896.4 | 2,730.8 | 2,581.2 | 2,438.4 | 2,571.3 | 2,367.9 | 2,290.1 | 2,052.7 | 2,059.1 | 2,499.3 | 2,494.4 |
| 2007 | 2,259.7 | 2,384.6 | 2,294.1 | 2,270.8 | 2,208.5 | 2,098.4 | 2,057.8 | 2,137.8 | 2,173.1 | 2,281.5 | 2,248.9 | 2,254.4 |
| 2008 | 2,079.3 | 2,080.5 | 2,010.5 | 2,113.1 | 2,060.8 | 1,959.2 | 1,899.3 | 1,988.6 | 2,073.2 | 2,044.6 | 2,016.7 | 1,978.2 |
| 2009 | 1,952.7 | 1,960.1 | 1,923.1 | 1,916.0 | 1,890.5 | 1,765.7 | 1,656.7 | 1,634.1 | 1,620.9 | 1,538.9 | 1,544.5 | 1,360.4 |
| 2010 | 1,013.1 | 1,080.3 | 784.4 | 636.7 | 535.3 | 530.0 | 542.0 | 486.0 | 458.6 | 473.4 | 455.1 | 330.0 |
| 2011 | 171.3 | 160.5 | 167.5 | 152.3 | 147.5 | 148.2 | 142.6 | 141.2 | 116.0 | 117.1 | 111.3 | 104.8 |
| 2012 | 70.5 | 77.9 | 74.1 | 84.6 | 92.4 | 97.3 | 93.1 | 79.4 | 70.9 | 80.5 | W | 65.3 |
| 2013 | 52.8 | 51.3 | 55.3 | 47.2 | 60.2 | 83.1 | 69.5 | 65.6 | 52.6 | 55.2 | 64.0 | 63.8 |
| 2014 | W | W | W | W | W | W | W | W | W | W | W | W |
| 2015 | W | W | W | W | W | W | W | W | W | W | W | W |
| 2016 | W | W | W | W | W | W | W | W | W | W | W | W |
| 2017 | W | W | W | W | W | W | W | W | W | W | W | W |
| 2018 | W | W | W | NA | - | - | - | - | - | - | - | - |
| 2019 | - | W | - | - | - | - | - | - | - | - | - | - |
| 2020 | - | - | - | - | - | W | W | W | W | W | W | W |
| 2021 | W | W | W | W | W | W | W | W | W | - | - | - |
| 2022 | - | - | - | |||||||||
| - = No Data Reported; -- = Not Applicable; NA = Not Available; W = Withheld to avoid disclosure of individual company data. |
| Release Date: 6/1/2022 |
| Next Release Date: TBD |