|
Download Data (XLS File) |
|
||||||||
|
||||||||
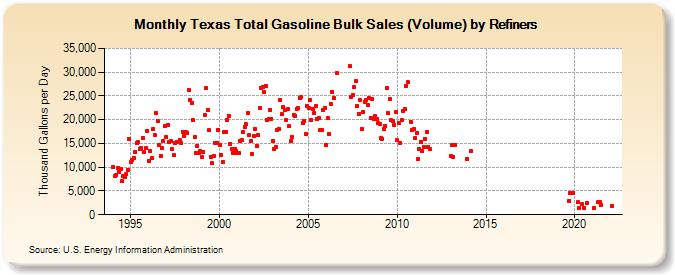
| Texas Total Gasoline Bulk Sales (Volume) by Refiners (Thousand Gallons per Day) | ||||||||
| Year | Jan | Feb | Mar | Apr | May | Jun | Jul | Aug | Sep | Oct | Nov | Dec |
|---|---|---|---|---|---|---|---|---|---|---|---|---|
| 1994 | 10,010.9 | 8,121.2 | 8,383.7 | 9,841.8 | 8,957.5 | 9,595.6 | 7,007.1 | 8,182.5 | 7,837.8 | 8,555.5 | 9,465.9 | 15,843.4 |
| 1995 | 11,087.9 | 11,531.0 | 12,015.5 | 13,256.8 | 15,134.7 | 15,257.8 | 13,871.8 | 14,076.8 | 16,217.3 | 13,248.2 | 13,943.0 | 17,693.5 |
| 1996 | 11,199.7 | 13,389.8 | 11,933.7 | 18,076.3 | 16,785.0 | 21,436.1 | 19,774.5 | 14,630.2 | 12,444.2 | 14,029.0 | 15,441.1 | 18,575.7 |
| 1997 | 16,260.1 | 18,917.3 | 15,304.4 | 15,477.5 | 13,811.4 | 12,472.5 | 15,161.3 | 15,354.4 | 15,321.0 | 15,630.9 | 15,000.6 | 17,455.3 |
| 1998 | 16,483.3 | 17,379.6 | 17,218.2 | 26,230.2 | 24,178.6 | 23,447.3 | 19,866.5 | 16,271.9 | 13,054.9 | 14,513.2 | 12,947.6 | 13,391.4 |
| 1999 | 12,058.0 | 13,241.8 | 21,086.6 | 26,648.6 | 21,996.6 | 17,735.2 | 12,215.4 | 10,812.9 | 12,366.6 | 15,088.9 | 15,182.0 | 17,883.1 |
| 2000 | 14,719.5 | 12,576.2 | 11,169.2 | 17,424.7 | 17,510.8 | 20,031.1 | 20,875.6 | 14,908.5 | 13,727.1 | 13,067.9 | 13,839.2 | 13,444.2 |
| 2001 | 12,984.8 | 12,929.2 | 15,490.5 | 15,629.7 | 17,454.8 | 18,431.9 | 19,080.1 | 21,342.4 | 16,675.3 | 15,494.3 | 12,826.5 | 16,602.5 |
| 2002 | 17,998.3 | 14,464.3 | 16,759.0 | 22,461.0 | 26,664.2 | 26,803.8 | 25,810.6 | 27,184.3 | 19,877.4 | 20,124.6 | 22,113.0 | 20,219.1 |
| 2003 | 15,538.9 | 13,834.0 | 14,279.9 | 17,867.1 | 18,130.5 | 24,123.7 | 21,097.0 | 22,616.7 | 21,967.0 | 19,982.1 | 22,144.9 | 18,594.4 |
| 2004 | 15,453.0 | 16,404.0 | 21,068.0 | 20,828.6 | 22,202.2 | 22,444.0 | 24,654.8 | 24,693.5 | 19,331.8 | 19,674.3 | 16,908.8 | 22,789.1 |
| 2005 | 22,558.5 | 24,168.8 | 19,886.2 | 22,262.5 | 21,324.2 | 22,789.3 | 20,119.8 | 20,301.5 | 17,927.6 | 17,740.2 | 22,122.1 | 22,461.1 |
| 2006 | 14,716.8 | 20,358.8 | 17,024.3 | 23,267.6 | 25,776.6 | 24,567.6 | W | 29,728.1 | W | W | W | W |
| 2007 | W | W | W | W | 31,211.5 | 24,844.5 | 25,234.0 | 26,803.7 | 28,110.0 | 22,926.7 | 21,296.4 | 24,136.4 |
| 2008 | 18,132.7 | 21,655.3 | 23,702.7 | 24,170.0 | 23,149.1 | 24,565.7 | 20,366.9 | 24,249.6 | 20,141.0 | 20,772.0 | 20,072.4 | 19,282.6 |
| 2009 | 19,106.8 | 16,089.1 | 15,971.2 | 18,038.8 | 18,646.9 | 26,562.6 | 21,372.9 | 24,321.9 | 19,854.6 | 19,637.8 | 18,845.6 | 21,613.2 |
| 2010 | 15,670.7 | 19,392.8 | 15,191.3 | 19,859.1 | 21,785.8 | 22,267.5 | 27,115.8 | 27,908.8 | W | 19,593.5 | 17,820.6 | 18,010.5 |
| 2011 | 16,068.4 | 17,118.8 | 11,753.6 | 13,861.3 | 15,357.3 | 13,327.8 | 14,250.6 | 15,936.3 | 17,382.3 | 14,195.6 | 13,866.5 | W |
| 2012 | W | W | W | W | W | W | W | W | W | W | W | W |
| 2013 | 12,389.4 | 14,624.2 | 12,146.9 | 14,606.8 | W | W | W | W | W | W | W | 11,622.7 |
| 2014 | W | W | 13,379.4 | W | W | W | W | W | W | W | W | W |
| 2015 | W | W | W | W | W | W | W | W | W | W | W | W |
| 2016 | W | W | W | W | W | W | W | W | W | W | W | W |
| 2017 | W | W | W | W | W | W | W | W | W | W | W | W |
| 2018 | W | W | W | W | W | W | W | W | W | W | W | W |
| 2019 | W | W | W | W | W | W | W | W | 2,940.5 | 4,674.3 | W | 4,616.4 |
| 2020 | W | W | 2,589.1 | 1,496.5 | W | 2,172.8 | 1,511.5 | W | 2,381.7 | W | W | W |
| 2021 | W | 1,493.0 | W | W | 2,705.3 | 2,680.1 | 2,107.8 | W | W | W | W | W |
| 2022 | W | 1,838.5 | W | |||||||||
| - = No Data Reported; -- = Not Applicable; NA = Not Available; W = Withheld to avoid disclosure of individual company data. |
| Release Date: 6/1/2022 |
| Next Release Date: TBD |